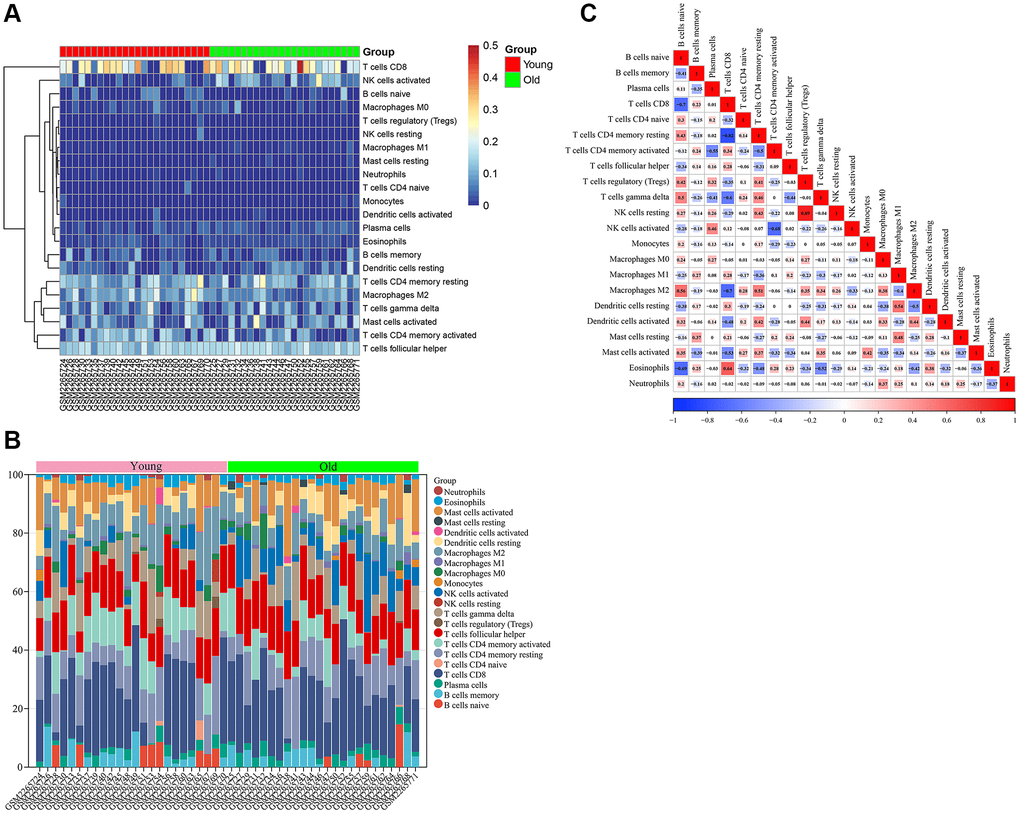
Figure 8.Immune infiltration analysis of GSE85358 dataset. (A) Heat map of immune cell infiltration in skin tissue of old and young groups. (B) Bar graph of immune cell infiltration in skin tissue of old and young groups. (C) Correlation between 22 characteristic immune cells in skin samples.