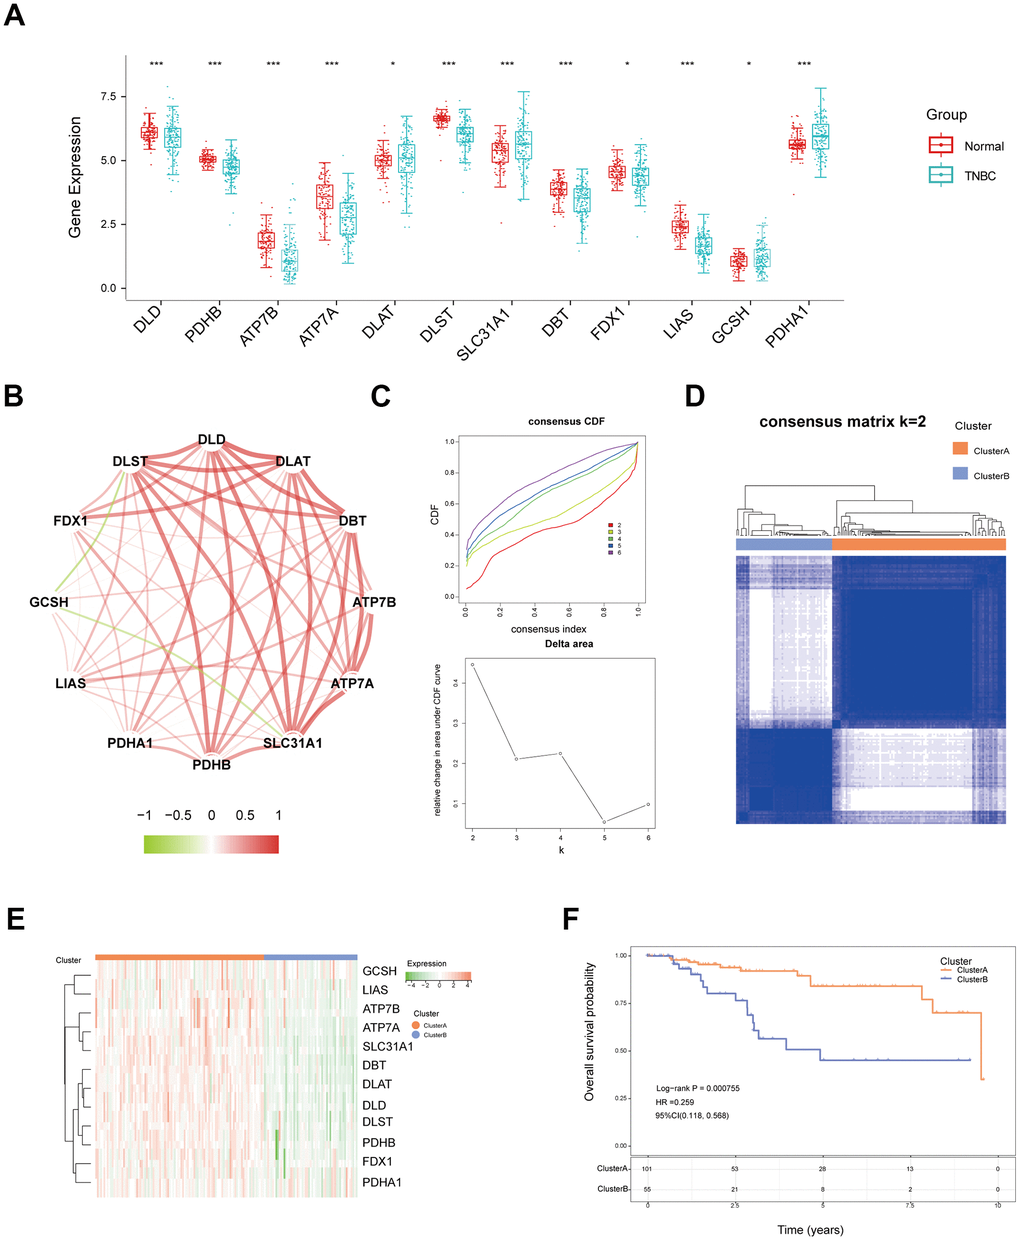
Figure 2.Identification of different cuproptosis patterns in TNBC. (A) The expression of twelve cuproptosis-related genes in normal and TNBC tissues from TCGA data. (B) The correlation network between twelve cuproptosis genes in TNBC. (C) Cumulative distribution function (CDF) and relative change in the area under the CDF curve (CDF Delta area) of consensus clustering based on cuproptosis-related genes. (D) Unsupervised consensus clustering (k = 2) divides TNBC samples into cluster A and cluster B based on 12 cuproptosis-related genes. (E) The different expression of twelve cuproptosis genes between two clusters displayed with a heatmap. (F) KM curves of overall survival for the two cuproptosis clusters. (* P<0.05, **P< 0.01).