


Introduction
Breast cancer is the most prevalent form of cancer among women, exhibiting high heterogeneity [1]. Triple-negative breast cancer (TNBC) is a subtype of breast cancer characterized by the absence of estrogen receptor, progesterone receptor, and HER2 expression [2]. Despite significant improvements in overall survival rates for breast cancer patients in recent decades, the clinical outcomes for TNBC patients remain poorer compared to Luminal and HER2-enriched subtypes [3, 4]. TNBC exhibits aggressive biological behavior, leading to high recurrence rates, treatment failures, and unfavorable prognoses [3, 4]. Current treatment strategies for TNBC primarily involve surgery and chemotherapy but often fail to achieve satisfactory efficacy [2]. Recently, the combination of chemotherapy with targeted drugs or immune checkpoint blockades (ICBs), had shown promising results in improving outcomes for a subset of TNBC patients. Nonetheless, due to the heterogeneity of the tumor, great challenges persist in selecting potentially responsive patients and overcoming drug resistance [5, 6]. Thus, the exploration of a novel risk stratification model for prognosis and treatment response is of utmost importance for enhancing the clinical management of TNBC.
A new form of copper-induced programmed cell death termed “cuproptosis” has caused great attention from researchers. Copper (Cu) is an essential mineral nutrient within the tumor body, and its imbalance was implicated in various diseases, including Menkes disease, Wilson disease, Alzheimer’s disease, and cancers [7]. It has been demonstrated that copper directly binds to the lipoylated components of the tricarboxylic acid (TCA) cycle, leading to the accumulation of fatty acylating protein, excessive production of reactive oxygen species (ROS), and eventually cell death. Dysregulation of cuproptosis can affect various biological processes, such as cell proliferation and angiogenesis to influence tumor progression [8]. Thus, investigating the genes involved in cuproptosis regulation is of great importance [9]. Recent studies have demonstrated that a copper transporter, P-type ATPase transporter (ATP7A) can activate VEGFR2 signaling and angiogenesis, promoting cancer progression [10]. Copper transporter 1 (CTR1) is associated with immune evasion in different cancer types by regulating PD-L1 expression [11]. Reduced expression of ferredoxin 1 (FDX1) in clear cell renal cell carcinoma has been linked to metastasis, worse outcomes, suppressed immune cell infiltration, and decreased expression of immune markers [12, 13]. Thus, cuproptosis is not only associated with tumor proliferation, invasion, and metastasis but also can affect tumor immunity.
Immunotherapies such as anti-PD-1/PD-L1 and anti-CTLA4 are important treatments for TNBC. Therefore, it is crucial to determine the TNBC patients who are sensitive to immunotherapy. It has been demonstrated that immune cell infiltration and immune checkpoint expression were closely associated with clinical benefits from immunotherapy [6, 14]. The expression of immune checkpoints such as PD-L1 in tumor samples serves as the most commonly used biomarker for predicting the potential efficacy of ICBs, as patients with high expression of immune checkpoints are more likely to obtain a favorable clinical response to immunotherapy [14, 15]. The tumor microenvironment (TME) encompasses a complex network of immune cells, stromal cells, and extracellular matrix components, and can be categorized into inflamed (hot tumor) and non-inflamed (cold tumor) phenotypes based on the infiltration of tumor-infiltrating lymphocytes (TILs) [16, 17]. Generally, inflamed tumors tend to be more sensitive to currently utilized ICBs. For non-inflamed tumors that may respond poorly to immunotherapies, molecular target therapies might be salvage treatment options, such as inhibitors for PI3K/AKT/mTOR pathway and EGFR for TNBC [18–20]. Based on these findings, there is an urgent need to investigate the association between cuproptosis and tumor immunity for improving individualized treatment for TNBC patients.
However, a systematic analysis of cuproptosis and immune-related genes in TNBC is still lacking. In this study, we classified TNBC into two distinct subtypes based on cuproptosis-related genes. Recognizing the close association between cuproptosis regulation and tumor immunity, we are the first study to integrate cuproptosis-related genes with immune-related genes to construct a risk model for predicting immunotherapy efficacy, identifying potential therapeutic agents, and determining the prognosis of patients in triple-negative breast cancer.
Results
Cuproptosis regulated patterns in TNBC
The study design is presented in the flow chart (Figure 1). We observed differential expression of 12 cuproptosis-related genes between TNBC samples and paired normal tissues, indicating dysregulation of these genes in TNBC (Figure 2A). We further explored the relationship among these cuproptosis-related genes and found potential interactions between each gene (Figure 2B). Inspired by above results, we hypothesized that TNBC might present different regulated patterns according to cuproptosis-related gene expression, and then performed a consensus clustering analysis with TNBC samples. The TNBC patients were divided in two clusters (k value = 2), named cuproptosis cluster A and cluster B (Figure 2C, 2D). As expected, the differential expression of cuproptosis-related genes between the two clusters indicated distinct cuproptosis patterns in TNBC (Figure 2E). Importantly, the overall survival analysis revealed the difference prognosis in two cuproptosis-related clusters, suggesting that different cuproptosis patterns were associated with the clinical outcome of TNBC patients (Figure 2F).
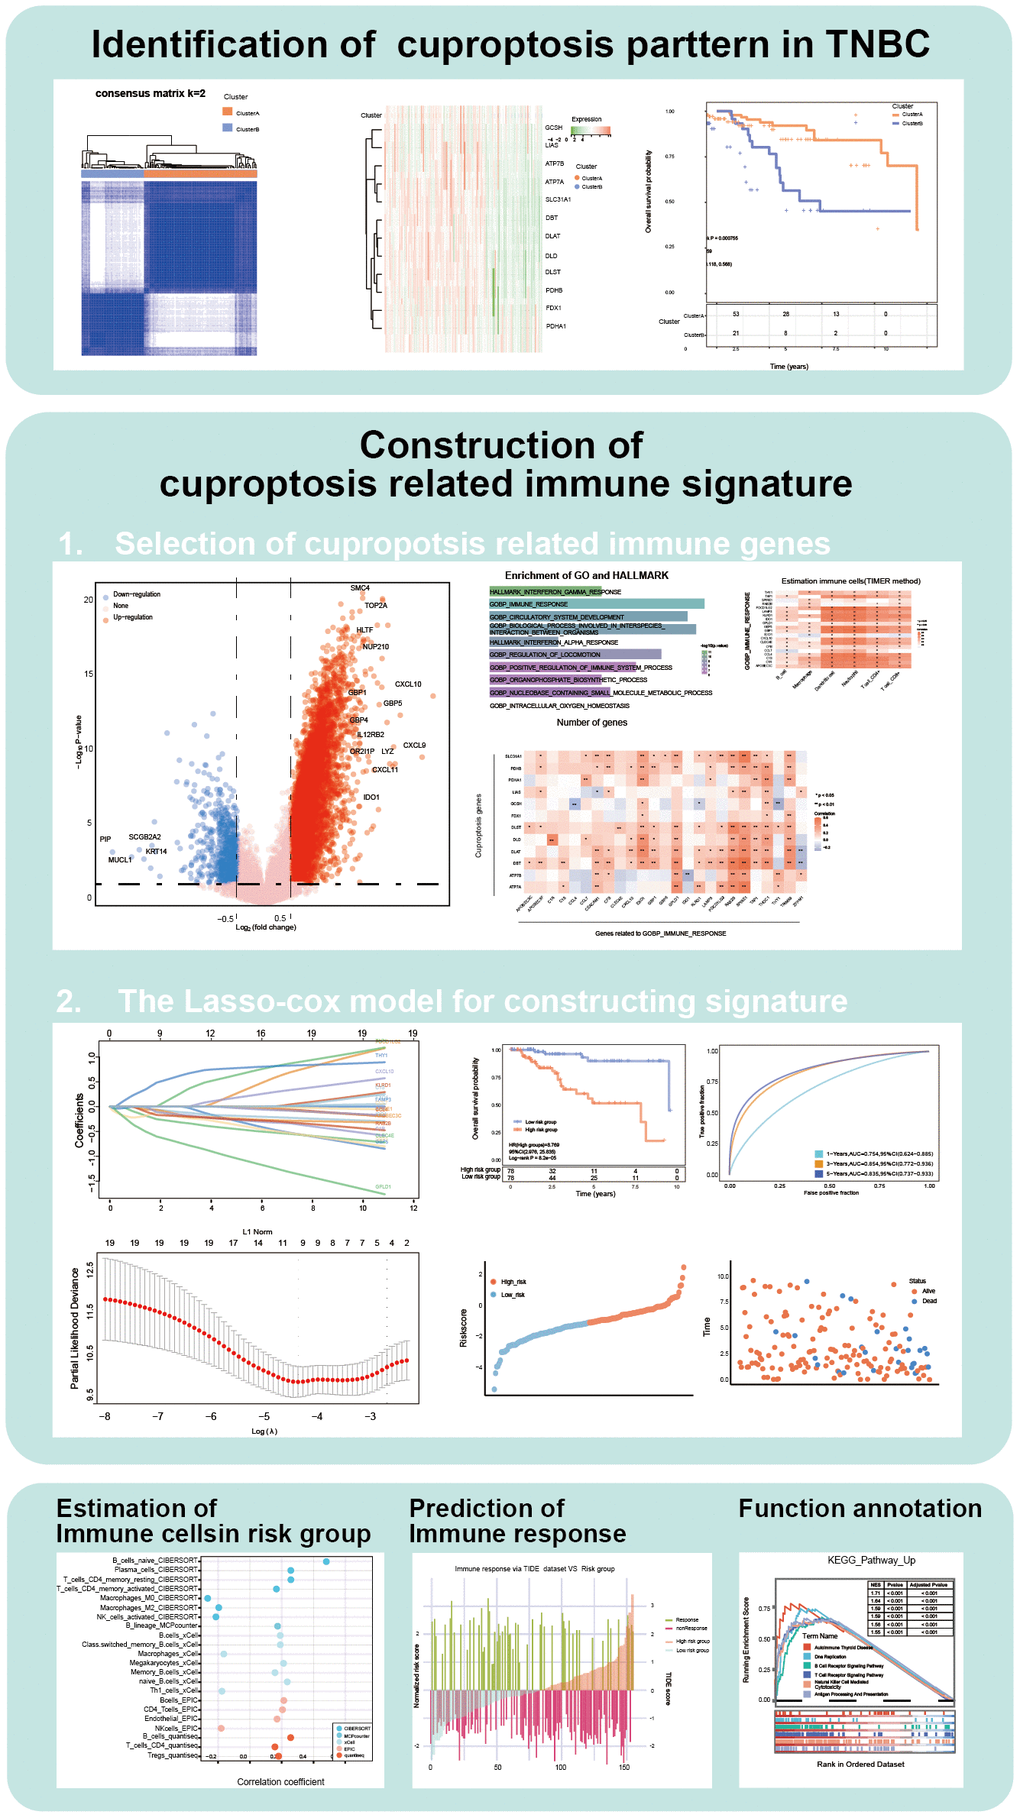
Figure 1. Flow chart of our study.
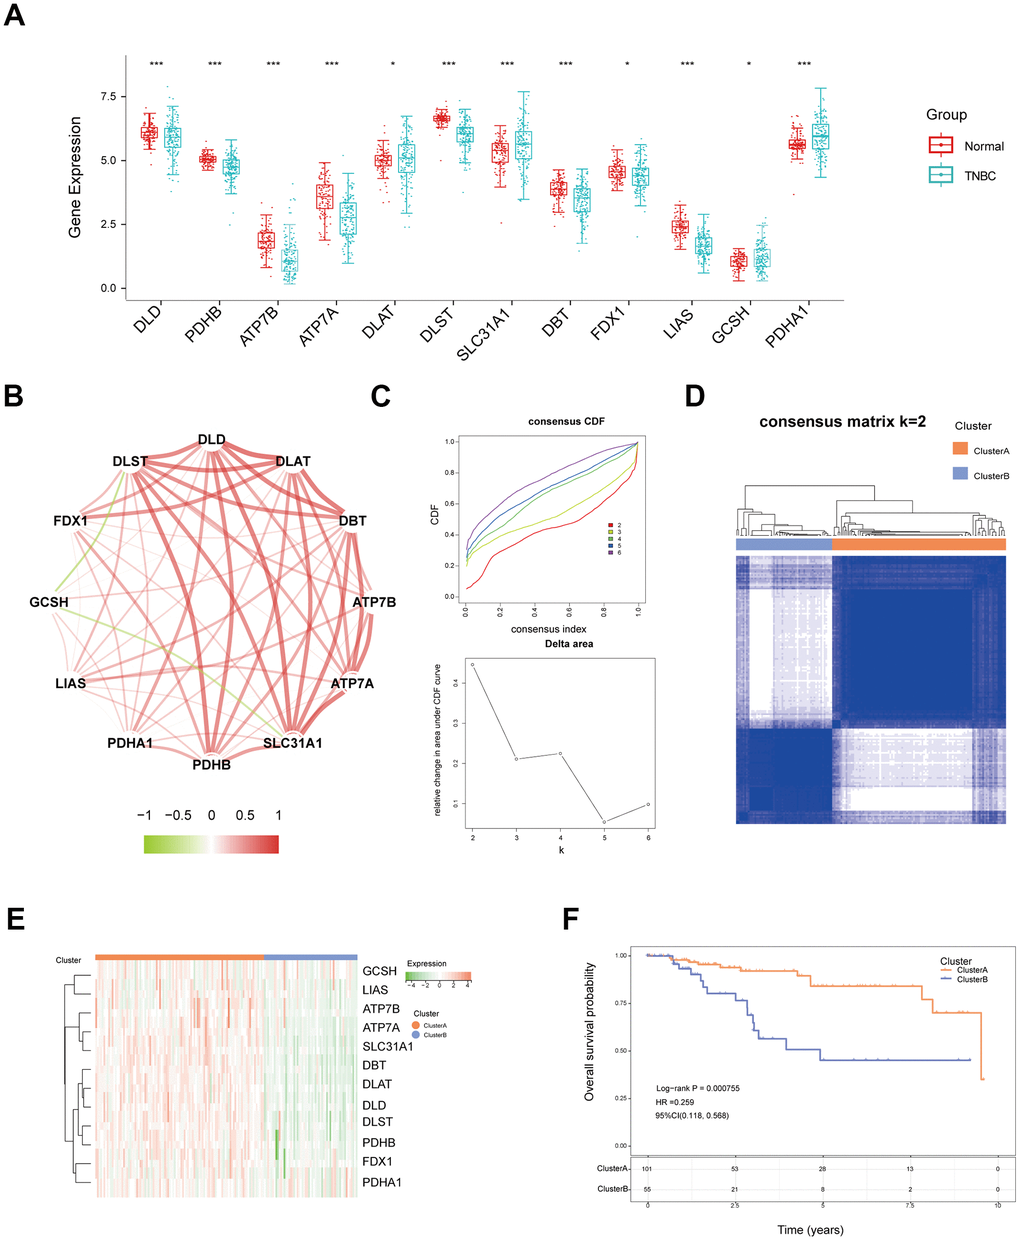
Figure 2. Identification of different cuproptosis patterns in TNBC. (A) The expression of twelve cuproptosis-related genes in normal and TNBC tissues from TCGA data. (B) The correlation network between twelve cuproptosis genes in TNBC. (C) Cumulative distribution function (CDF) and relative change in the area under the CDF curve (CDF Delta area) of consensus clustering based on cuproptosis-related genes. (D) Unsupervised consensus clustering (k = 2) divides TNBC samples into cluster A and cluster B based on 12 cuproptosis-related genes. (E) The different expression of twelve cuproptosis genes between two clusters displayed with a heatmap. (F) KM curves of overall survival for the two cuproptosis clusters. (* P<0.05, **P< 0.01).
Identification of cuproptosis and immune-related genes
To further investigate the effect of cuproptosis in TNBC, we firstly identified the differentially expressed genes (DEGs) between cluster A and cluster B (Figure 3A and Supplementary Table 1). Subsequently, through a univariate Cox and intersection analysis, 207 prognostic DEGs were used to investigate the association between cuproptosis and biological characteristics of TNBC (Figure 3B). The Gene Ontology (GO) and HALLMARK analysis revealed that the genes were significantly enriched in HALLMARK_INTERFERON_GAMMA_RESPONSE and GOBP_IMMUNE_RESPONSE (Supplementary Table 2). The results above indicated the potential involvement of immune-related mechanisms in cuproptosis (Figure 3C).
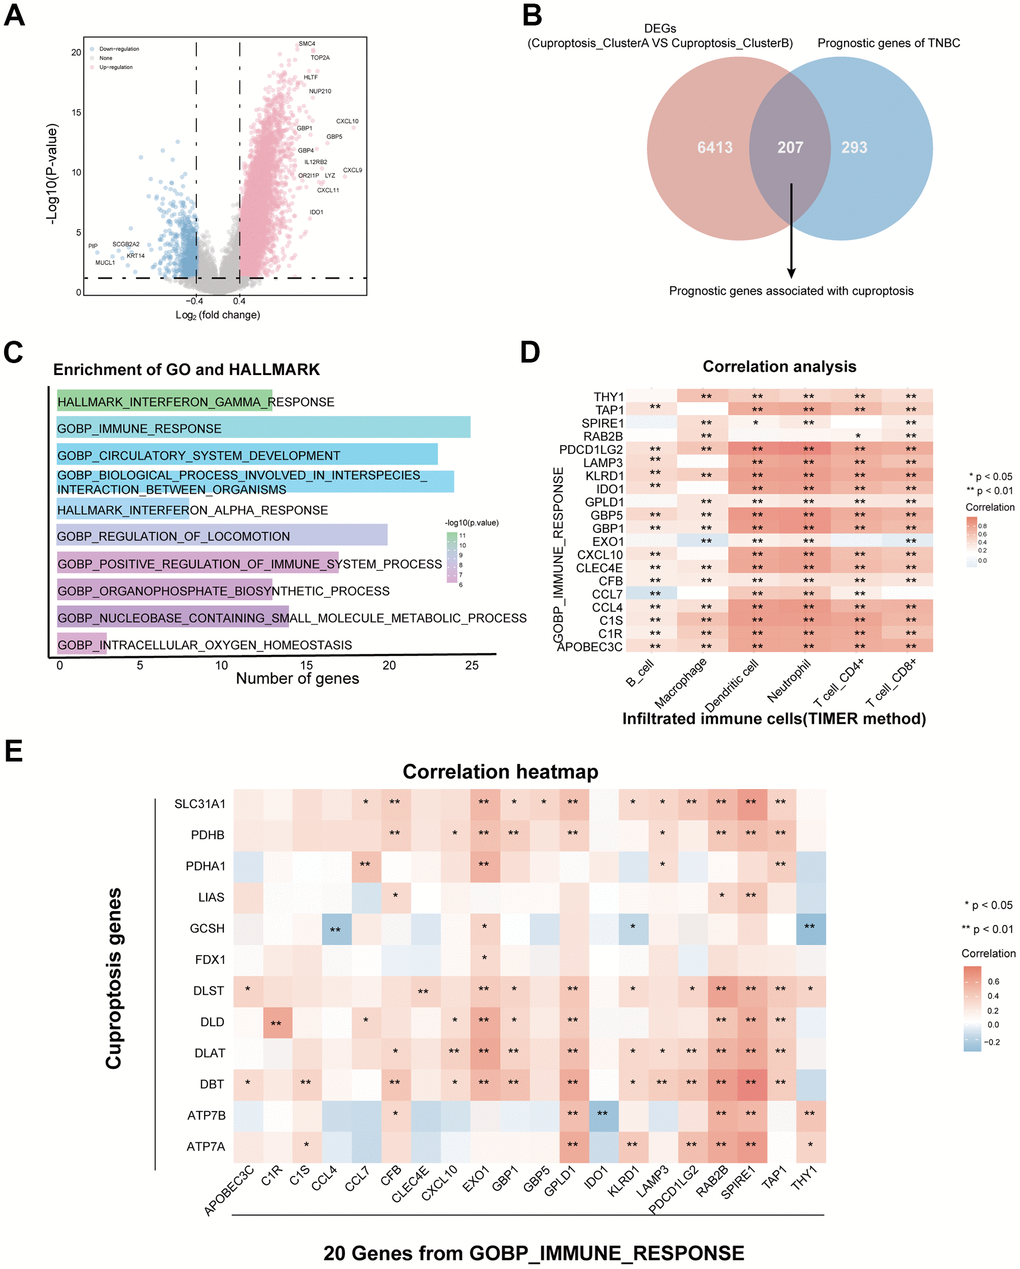
Figure 3. Identification of cuproptosis and immune-related genes in TNBC. (A) Volcano plot exhibiting the differentially expressed genes (DEGs) between the two cuproptosis clusters. (B) Screening 207 prognosis DEGs through the intersection of DEGs and prognostic genes in TNBC. (C) Enrichment analysis with GO and HALLMARK pathways based on 207 prognosis DEGs. (D) Identification of 20 prognostic DEGs associated with GO_IMMUNE_RESPONSE and immune infiltrated cells. (E) The correlation heatmap of 20 immune genes with 12 cuproptosis genes. (* P<0.05, **P< 0.01).
Furthermore, we identified 20 prognostic DEGs which overlapped with the GO_BP_IMMUNE_RESPONSE gene set and correlated with immune cell infiltration in TNBC by the TIMER algorithm (Figure 3D). We also validated the significant correlation between these 20 prognostic DEGs and the 12 cuproptosis-related genes (Figure 3E). Therefore, we considered these 20 genes as cuproptosis and immune-related genes (CIRGs) which provided an opportunity for us to recognize the interaction between cuproptosis and tumor immunity.
Construction of prognostic cuproptosis and immune-related gene signature
The prognostic value of CIRGs were visualized by the forest plot (Figure 4A). Then, LASSO-Cox method successfully selected nine hub genes to construct a cuproptosis and immune related signature (CIS) and divided TNBC patients into high- and low- CIS groups according to the score of each TNBC patients (Figure 4B). The coefficient of each hub gene was displayed by the Lollipop plot (Figure 4C). The different mRNA expression profile of nine hub genes in high- and low-CIS groups were displayed by a heatmap (Figure 4D). Importantly, the overall survival of TNBC patients in high-CIS group was significantly better than low-CIS group in the TCGA cohort (Figure 5A). In addition, the area under curve (AUC) values of 1, 3, 5-year ROC curved were larger than 0.7, suggesting a satisfied predictive accuracy of CIS score for TNBC prognosis (Figure 5B). The distribution of patients with different survival status and CIS score also suggested that a high CIS score was associated with a worse outcome (Figure 5C). Consistently, the predictive ability of CIS was validated in GSE81540 and GSE58812 cohorts (Supplementary Figures 1A, 1B, 2A, 2B). The overall survival analysis showed poorer prognosis in high-CIS group, compared with low-CIS group, and the ROC curves indicated the high predictive accuracy of CIS for predicting TNBC overall survival (AUC value of 1-, 3-, 5-year OS was 0.705, 0.815 and 0.786 respectively) in GSE81540 cohort (Supplementary Figure 1A, 1B) and (AUC value of 1-, 3-, 5-year OS was 0.869, 0.752 and 0.763 respectively) in GSE58812 cohort (Supplementary Figure 2A, 2B). The distribution of CIS score and survival status of patients showed that higher CIS score was related to poorer prognosis in the validation set (Supplementary Figures 1C, 1D, 2C, 2D). In conclusion, these results revealed that CIS had a robust performance to predict prognosis of TNBC.
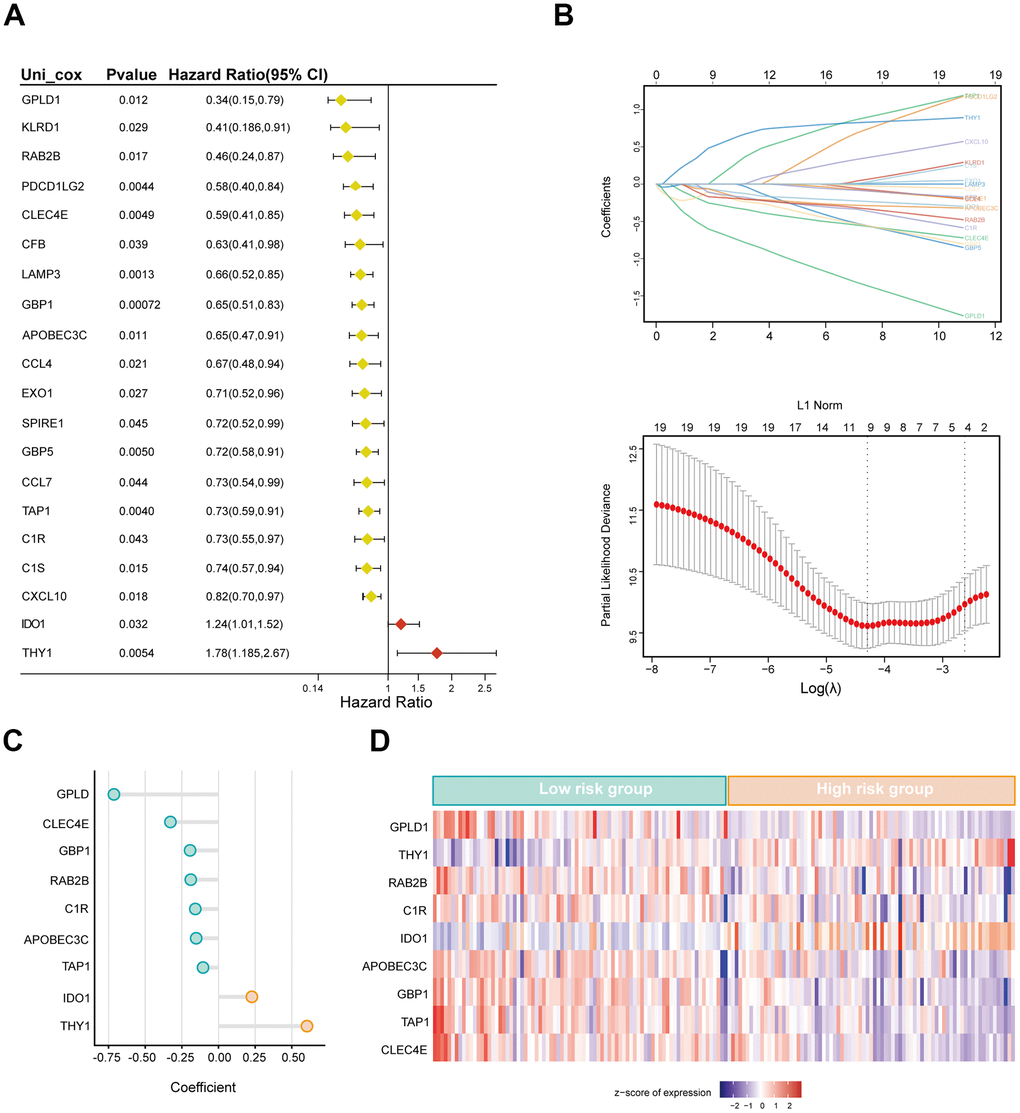
Figure 4. Construction of cuproptosis-related immune signature (CIS) based on the LASSO-Cox model. (A) Forest plot of hazard ratios manifesting the prognostic values of cuproptosis-related immune genes. (B) LASSO-Cox regression analysis for variable selection and construction of signature for TNBC. (C) The corresponding coefficient of nine selected genes. (D) The expression profile of nine selected genes in high- and low-risk group.
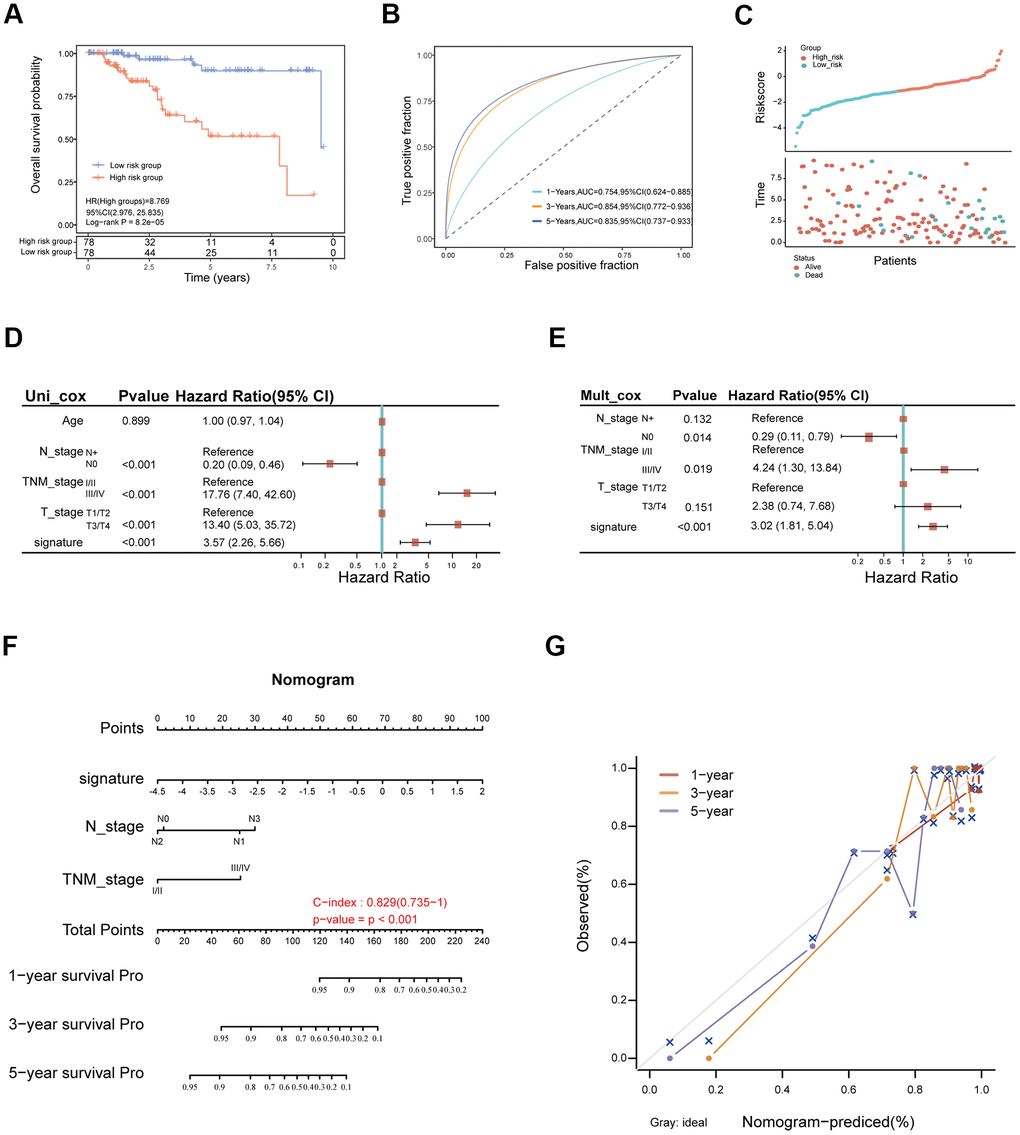
Figure 5. The clinical significance of cuproptosis-related immune signature in TNBC. (A) The Kaplan-Merier curves for overall survival of low- and high-risk groups. (B) The ROC curves of CIS for predicting 1-, 3-, and 5-year overall survival in the TGCA-TNBC cohort. (C) The distribution of TNBC patients according to CIS score and survival status. (D, E) Univariate Cox analysis (D) and, multivariate Cox analysis (E) of clinical factors and CIS score in TCGA cohort. (F) Construction of nomogram for predicting 1-, 3-, and 5-year overall survival of TNBC patients. (G) Calibration curves of the nomogram for predicting the probability of OS at 1-, 3-, and 5-years survival in the TCGA cohort.
CIS is an independent prognostic factor for TNBC
To identify the clinical factors associated with the prognosis of TNBC, we used univariate and multivariate Cox regression analysis to estimate the hazard ratio of CIS score and common clinicopathological features in TCGA-TNBC cohorts. The results of univariate Cox regression analysis showed that CIS was a strong risk factor for OS in TNBC patients (In TCGA cohort, Hazard Ratio (HR): 3.57, 95% Confidence Interval (CI): 2.26-5.66, P < 0.001, Figure 5D; in GSE81540 cohort, HR: 1.82, 95% CI:1.29-2.77, P = 0.004; Supplementary Figure 1E). The results of multivariate Cox regression analysis demonstrated that CIS score was an independent prognostic factor for TNBC patients after adjusting with clinical features (In TCGA, HR: 3.02, 95% CI: 1.81-5.04, P < 0.001 (Figure 5E); in GSE81540 cohort, HR: 1.02, 95% CI:1.32-1.87, P = 0.001; Supplementary Figure 1F). Thus, the above results indicated that CIS was an independent and effective prognostic factor for overall survival of TNBC patients. A nomogram was constructed based on CIS and prognostic clinical characteristics to predict 1-, 3-, and 5-year OS of individual TNBC patient to promote the application of CIS in clinical practice (Figure 5F). As expected, the high-nomogram total point was associated with a worse outcome in the TCGA-TNBC cohort (C-index = 0.829, P < 0.001). The calibration curves were highly concordance with the actual rates for 1-, 3-, and 5-year survival, indicating an excellent predictive capacity of the nomogram (Figure 5G).
Association between CIS and tumor immune phenotype
To gain insights into the immune status of individual TNBC patients, we firstly assessed immune cell infiltration and the expression of immune checkpoint genes in TNBC samples. The TIMER analysis revealed a significantly higher infiltration fraction of B cells, T cells CD8+ and T cells CD4+ in the high-CIS group (Figure 6A). Additionally, the CIS score exhibited a positive correlation with immune cell infiltration across various analyses (Figure 6B). Consistent with previous results, the CIBERSORT analysis showed that a high CIS score was correlated with high infiltration of B cells, T cells CD8+, T cells CD4+ and low infiltration of macrophages. Similar results were observed using MCPcounter, xCell, EPIC, and quantiseq algorithms (Figure 6B).
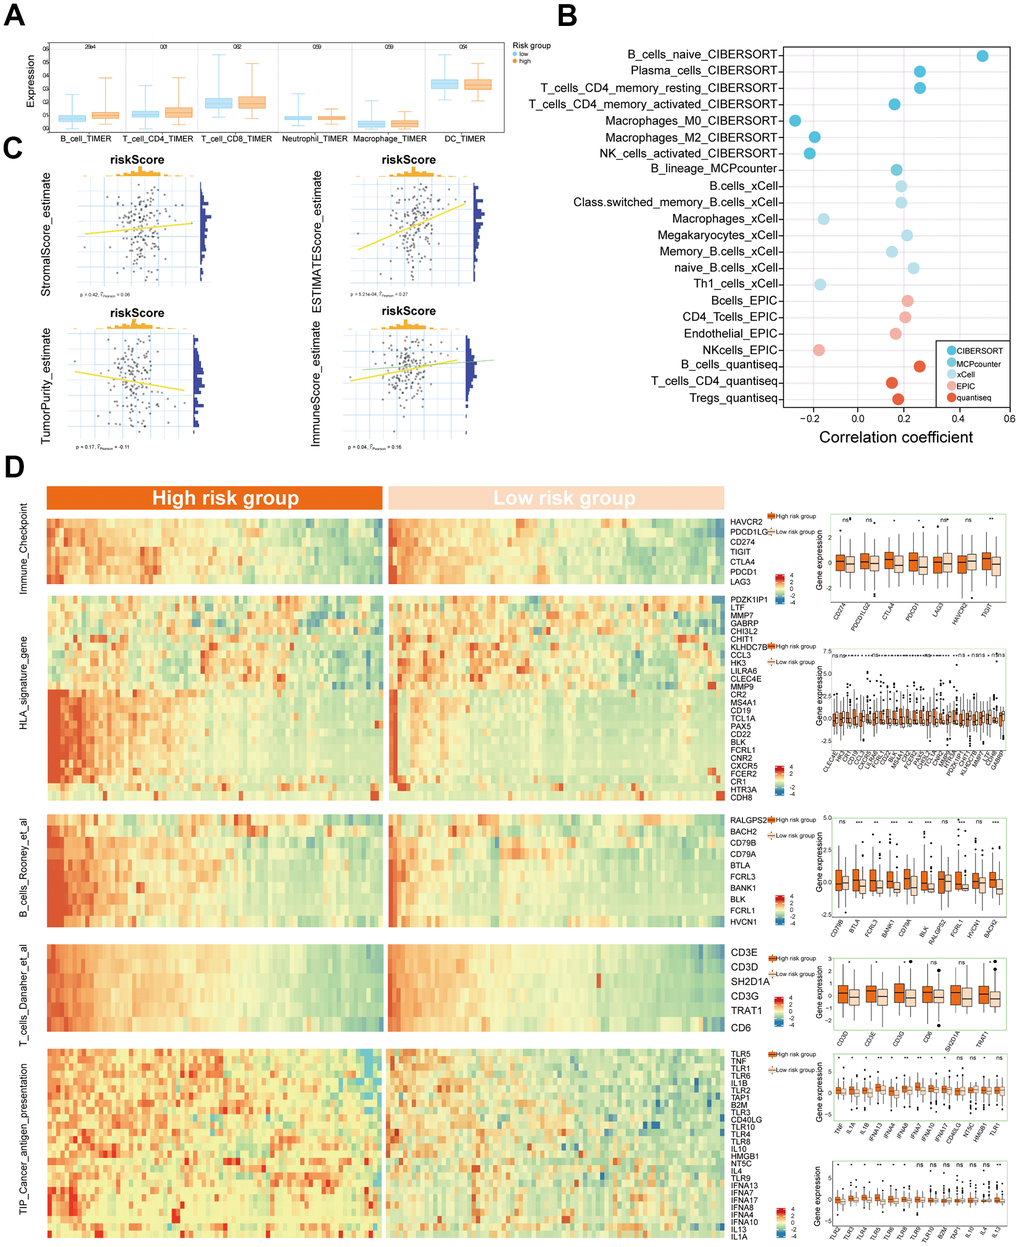
Figure 6. Association between CIS and tumor immune microenvironment. (A) The boxplot of the immune cell infiltration in low- and high-risk groups depending on TIMER estimation. (B) The significant correlation between immune cells and CIS score in CIBERSORT, MCPcounter, xCell, EPIC, and quantiseq analyses. (C) Comparison of the expression of genes from the signatures of Immune_check_point, HLA, B_cells_Rooney_et_al., B_cells_Danaher_et_al., T_cell_Danaher_et_al., and TIP_Cancer_antigen_presentation between low- and high -risk groups in heatmap and boxplot. (D) The correlation between CIS score and ESTIMATE algorithm evaluated scores in TNBC. (*P<0.05, **P< 0.01, ***P< 0.001).
In addition, we performed ESTIMATE analysis to further explore the immune status of individual TNBC patients. We found that CIS score was positively correlated to estimate_score and immune_score with statistical significance, and high CIS score was associated with high stromal score and low tumor purity in TNBC samples (Figure 6C). These findings suggested that CIS was significantly associated with the immune status of TNBC.
Moreover, we compared the expression of immune checkpoint genes between high- and low-CIS group. CTLA4, PDCD1, TIGIT were significantly higher expressed in high-CIS group. In the meanwhile, although no statistical significance, CD274 was slightly upregulation in high-CIS group (Figure 6D). Generally, dysregulated expression of HLA signaling genes has been reported to play important roles in the immune recognition, immune response and immunotherapy efficacy [20]. In this study, a majority of genes in HLA signature, including CR1/2, CD19, CD22, CCR5, MS4A1, were highly expressed in high-CIS group than that in low-CIS group, suggesting that the patients in high-CIS group might present induced immunological surveillance and boosted immune response that contribute to better response to immunotherapy (Figure 6C).
Expression level of genes in immune cell signatures were compared between high- and low-CIS groups to analysis the correlation between CIS and immune cell related genes (Figure 6C). Most of the genes in B_cells_Rooney_et_al. signature were upregulated in high-CIS group, including BTLA, FCRL3, BANK1, CD79A, BLK, FCRL1, BACH2. The expression of genes related to T_cells_Danaher_et_al. signature were investigated as well in TNCB samples, several genes such as CD3D/E/G and TRAT1 showed higher expression in high-CIS group than low-CIS group. Moreover, genes in TIP_Cancer_antigen_presentation signature were highly expressed in high-CIS group.
Above findings suggesting that CIS was significantly associated with anti-tumor immunity in TNBC, the patients in high-CIS group presented a higher rate of immune cell infiltration, higher expression of immune checkpoint genes and immune cell signature related genes, which might be more likely to benefit from immunotherapy, while the patients with low CIS score showed an immunosuppressive phenotype.
Predicition of response to immunotherapy and target drug
We further investigated whether the CIS score associated with the response to immunotherapy and predicted potential therapeutic drugs for patients in the low-CIS group. The TIDE algorithm was employed to predict the response of each TNBC patient to ICB treatments (Figure 7A). As anticipated, patients in the high-CIS group were more likely to exhibit favorable responses to immunotherapy (Fisher’s test, P < 0.05). The submap analysis further predicted that high CIS score might be significantly associated with anti-PD-1 response, while a low CIS score was related to resistance to anti-CTLA4 treatment (Figure 7B).
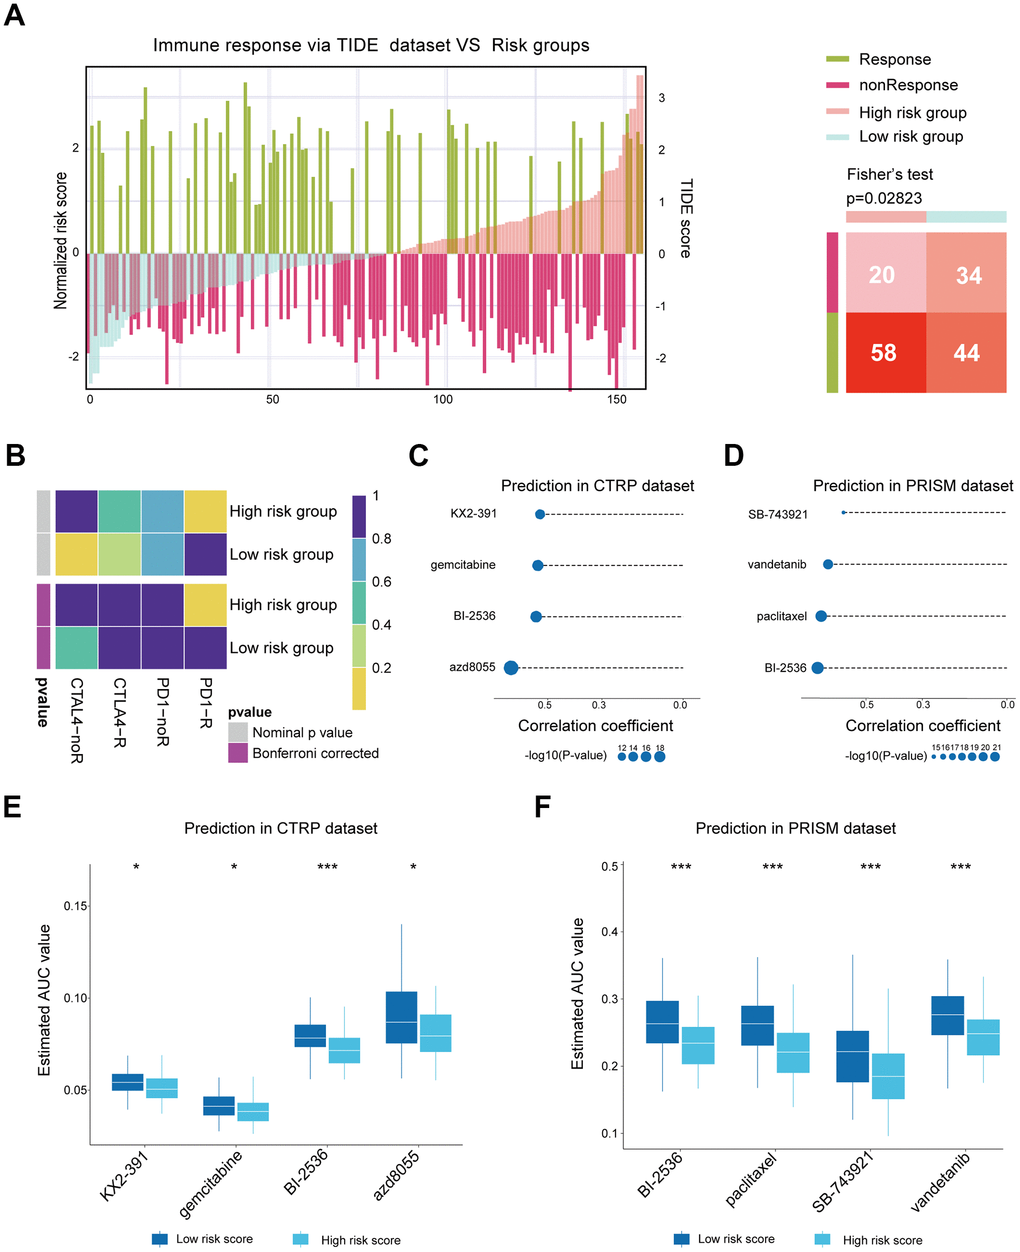
Figure 7. Predicting response to immunotherapy and potential therapeutic agents. (A) The distribution of the risk score and predicted immune therapy response based on the TIDE dataset (left). The numbers of patients who might potentially response or non-response to immunotherapy in two risk groups for Fisher’s test (right). (B) Submap analysis predicted potential response to immunotherapy in low- and high-risk groups. (C) Correlation between estimated AUC values of CTRP-derived compounds and CIS score. (D) Correlation between estimated AUC values of PRISM-derived compounds and CIS score. (E) Comparison of AUC values of CTRP-derived compounds between low- and high-risk groups. (F) Comparison of AUC values of PRISM-derived compounds between low- and high-risk groups. (*P<0.05, **P< 0.01, ***P< 0.001).
Since the low-CIS group might be insensitive to immunotherapies due to its immunosuppressive phenotype, we predicted the potential therapeutic small molecular agents for these patients. Four CTRP-derived compounds (KX2-391, gemcitabine, BI-2536, AZD8055) and four PRISM-derived compounds (SB743921, vandetanib, paclitaxel, BI-2536) were found to be sensitive in the low-CIS group (Figure 7C, 7D). These compounds had a negative correlation with the CIS score and lower estimated AUC values in the high-CIS group (Figure 7E, 7F).
Functional annotation of different CIS groups
To identify the biological processes associated with CIS in TNBC, GO and KEGG enrichment analysis were used for functional annotation for patients in different CIS groups. In GO analysis, high enrichment of the immune system process (GO: 0002376) was observed in the high-CIS group, while the cellular process (GO: 0009987) and metabolic process (GO: 0008152) were higher enriched in the low-CIS group (Figure 8A, 8B). The results of GSEA showed that KEGG pathways such as Steroid Hormone biosynthesis and Drug Metabolism Cytochrome P450 were highly enriched in the low-CIS group (Figure 8C). The immune-related pathways including B Cell Receptor Signaling Pathway and T cell Receptor Signaling Pathway were highly enriched in the high-CIS group (Figure 8D). Furthermore, since tumor metabolism was closely associated with tumor progression, we explored the difference of tumor metabolism regulation between two CIS groups by ssGSEA method to score 102 metabolism signatures based on gene expression profiles of TNBC samples [21]. We found that the scores of Glycogen Degradation, Drug Metabolism by Cytochrome P450, Steroid Biosynthesis and Tyrosine Metabolism were significantly higher in low-CIS group than high-CIS group (Figure 8E). Combining the results together, the dysregulated genes in high-CIS group mainly involved in regulation of tumor immunity, while genes in low-CIS group might participate in tumor metabolism.
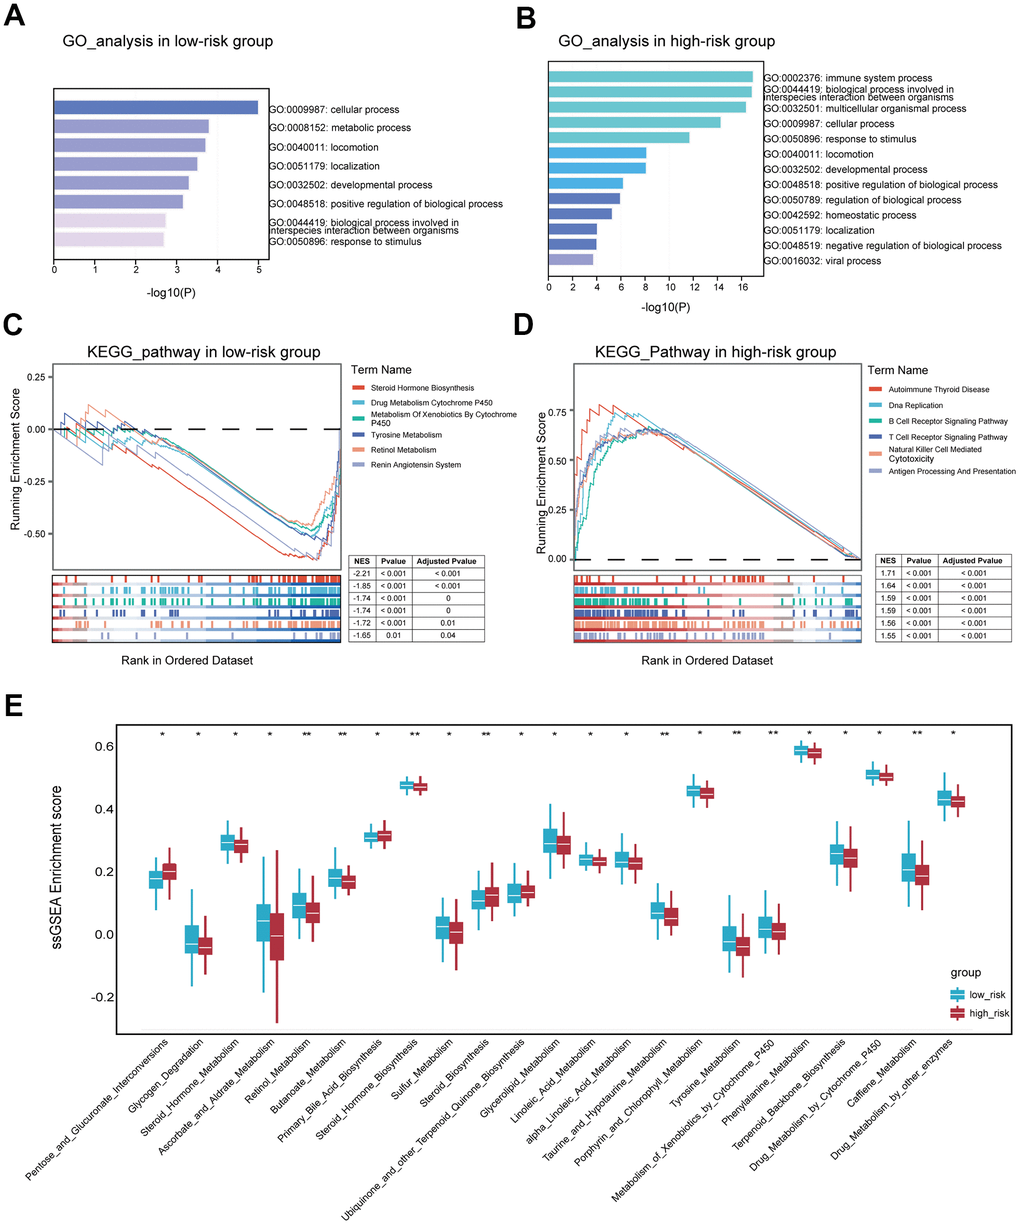
Figure 8. Functional analyses for patients in two risk groups. (A) GO analysis based on differentially expressed genes in low-risk samples. (B) GO analysis based on differentially expressed genes in high-risk samples. (C) Identifying KEGG pathways significantly enriched in the low-risk samples by GSEA. (D) Identifying KEGG pathways significantly enriched in the high-risk samples by GSEA. (E) Comparing the scores of signatures relating to tumor metabolism between low- and high-risk groups. (*P<0.05, **P< 0.01, ***P< 0.001).
Validating the expression of gene expression
Previous studies have demonstrated that IDO1 and THY1 could serve as oncogenes in cancers. Similarly, our result predicted that IDO1 and THY1 were associated with high prognostic risk in TNBC patients. The mRNA expression retrieved from breast cancer and normal tissue in the TCGA cohort showed that IDO1 and THY1 were significantly higher in TNBC samples than in normal samples (Figure 9A, 9C). Then, the results of qRT-PCR assays detecting mRNA expression of IDO1 and THY1 in TNBC cell lines (MDA-MB-231, MDA-MB-468) and normal cell line (MCF10A) were consistent with TCGA samples (Figure 9B, 9D). Moreover, we detected the protein expression of IDO1 and THY1 in TNBC and adjacent normal tissues by IHC staining. These results confirmed that IDO1 and THY1 were upregulated in TNBC than normal cells and tissues (Figure 9E, 9F). In our analysis of TNBC scRNA-seq data, we observed elevated expression of IDO1 and THY1 in cluster 3 and cluster 2, respectively, compared to the other clusters (see Supplementary Figure 2E, 2F).
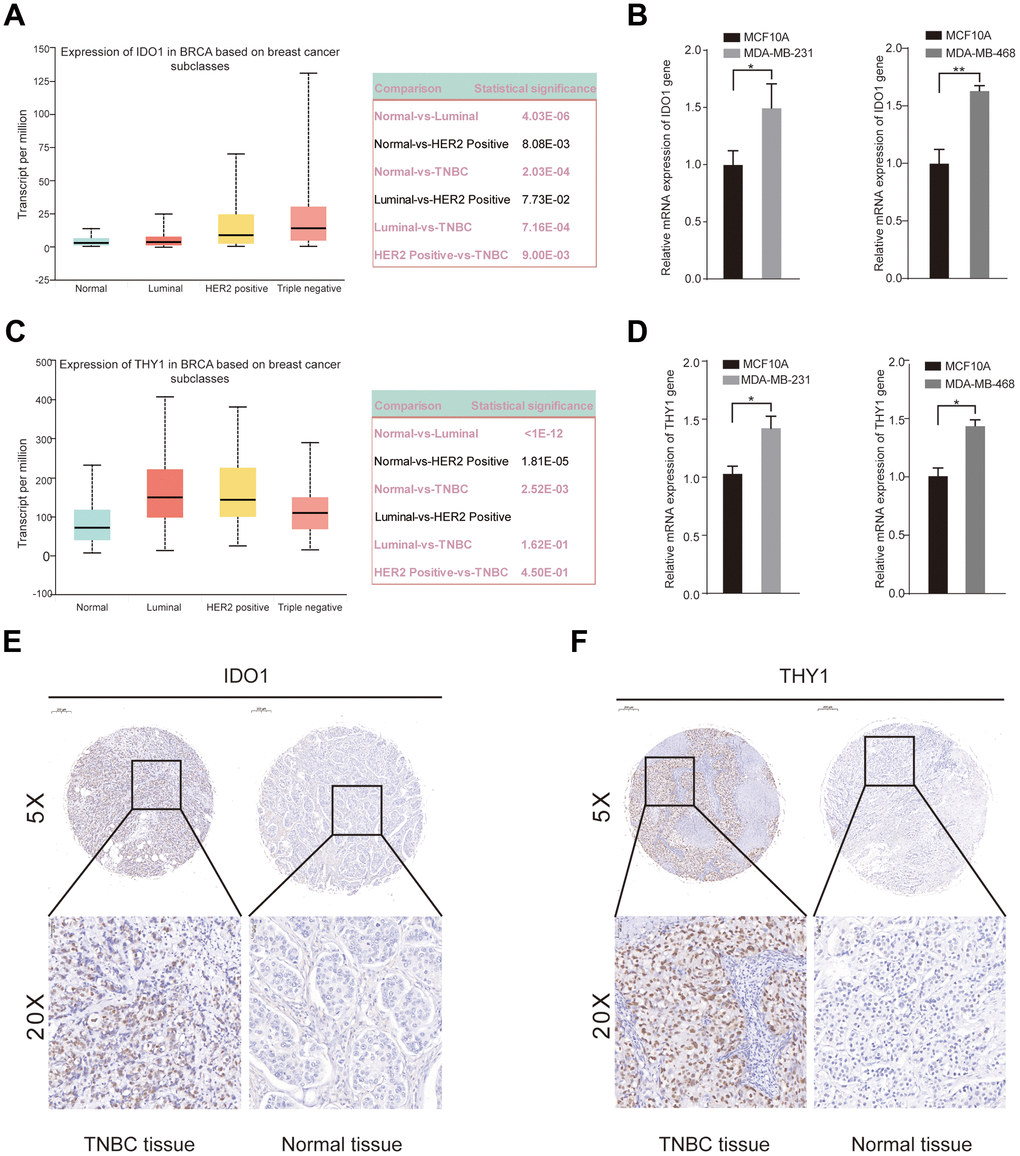
Figure 9. Upregulated expression of IDO1 and THY1 in TNBC cell lines and tissue samples. (A) Significantly different expression of the IDO1 among breast cancer tissues and normal tissues. (B) qRT-PCR examined the mRNA expression of IDO1 gene in MCF-10A, MDA-MB-231, and MDA-MB-468 cell lines. (C) Significantly different expression of the THY1 gene between breast cancer tissues and normal tissues. (D) qRT-PCR examined the mRNA expression of THY1 gene in MCF-10A, MDA-MB-231, and MDA-MB-468 cell lines. (E, F) IHC staining of IDO1 and THY1 protein in adjacent normal tissues and TNBC tissues. (*P<0.05, **P< 0.01, ***P< 0.001).
Discussion
As a vital bioinorganic element, copper ion plays important roles in many biological processes, and the dysfunction of copper homeostasis is related to various pathological disorders in mitochondrial respiration, redox reactions, and nutrient metabolism [22]. Becoming a topic of interest, recent studies reported that an imbalance of Cu was associated with pathological processes of cancer and immunotherapy efficacy [23, 24]. In vivo, evidence revealed that mitochondrial copper depletion could reduce TNBC progression [25]. A retrospective study reported that serum copper could be used to predict TNBC prognosis [26]. Cu ion could bind to lipoacylated components of the tricarboxylic acid cycle in mitochondrial respiration, induce oxidative stress, and even lead to Cu-regulated cell death, named cuproptosis [27]. Therefore, exploring the relationships among Cu homeostasis, cuproptosis, and tumor biological phenotype in TNBC might provide new insights for individualized treatments.
Many studies had revealed a complex interacting network between the genes involved in programmed cell death (ferroptosis, necroptosis, pyroptosis) and immune phenotype [28–30]. Similarly, recent studies have demonstrated that the genes involved in cuproptosis played important roles in tumor progression and cancer immune evasion [9]. For instance, significantly lower ferredoxin 1 (FDX1) expression in clear cell renal cell carcinoma was associated with metastasis, shorter OS, lower enrichment of invading immune cells, and expression of corresponding marker [13]. More importantly, FDX1 expression was positively correlated with the proportion of CD8+ T cells, and NK cells in cancer tissues [12]. Considering one of the most important copper influx transporters, copper transporter 1 (CTR-1) was correlated with PD-L1 expression and involved in immune evasion [23].
Immunotherapy such as immune checkpoint inhibitors has emerged as a prospective treatment by targeting PD-1/PD-L1 or CTLA4 and achieved clinical benefit in patients with breast cancer [6, 31–33]. However, a non-negligible proportion of TNBC patients showed poor response to ICBs due to tumor heterogeneity, and there was a clinical need to efficiently predict the potential sensitivity to immunotherapy for individual TNBC patients. PD-L1 expression, microsatellite instability status, and mutation burden have been considered to be inefficient to predict the potential response to immunotherapy [6, 34, 35]. Increasing evidence indicated that risk models constructed with genes associated with programmed cell death and tumor immunity could stably and efficiently predict survival outcomes and potential clinical benefits from immunotherapy [30, 36]. Therefore, our work comprehensively analyzed the correlation between immune response and cuproptosis in TNBC to improve the selection of patients for immunotherapy.
In this study, we first distinguished two clusters with significantly different outcomes in TNBC based on 12 cuproptosis-related genes published in a previous study [27]. To deeply explore cuproptosis patterns in TNBC, we included the genes that were dysregulated in two cuproptosis patterns (DEGs) and simultaneously correlated to the overall survival of TNBC for function annotation. The enrichment analysis suggested that the cuproptosis patterns were significantly associated with GOBP_IMMUNE_RESPONSE and HALLMARK_INTERFERON_GAMMA_RESPONSE pathways. Therefore, we defined the overlapping genes of the GOBP_IMMUNE_RESPONSE gene set, DEGs, and prognosis genes in TNBC as CIRGs. Later, these genes were subjected to LASSO-Cox analysis and constructed a CIS which successfully predicted the prognosis of TNBC, and divided the TNBC into two distinct phenotypes according to immune activity and metabolism.
As far as we know, this is the first study correlating cuproptosis patterns with immune response in TNBC. Therefore, we recognized the association between CIS and immune infiltrated cells, immune-related biomarkers, and the potential response of immune therapy. Through six algorithms for estimating immune cell infiltration, we identified that the B cells, CD4+ T cells, and CD8+ cells mainly infiltrated in the high-CIS group. The immune score and ESTIMATE score are positively associated with the CIS score. In addition, genes extracting from immune checkpoints, HLA genes, B_cells_Rooney_et_al. signature, T_cells_Danaher_et_al. signature, and TIP_Cancer_antigen_presentation signature were generally upregulated in patients of the high-CIS group. Furthermore, we performed TIDE and submap analysis to predict the response to immunotherapy in TNBC patients. These results suggested that patients with high CIS scores presented an inflamed phenotype and might be more likely to benefit from ICBs than patients in the low-CIS group. Based on CTRP and PRISM database, the patients with low CIS scores showed high sensitivity to several kinds of small molecular inhibitors including, Src kinase and tubulin-polymerization inhibitor (KX2-391), mTOR inhibitor (ADZ8055), a PLK1 inhibitor (BI-2536). The results also indicated that patients in the low-CIS group might obtain better clinical benefits from classical chemotherapies such as paclitaxel and gemcitabine, which have been demonstrated to be effective in many TNBC patients. Moreover, both the GSEA enrichment analysis and ssGSEA analysis based on IOBR indicated that patients in the low-CIS group were associated with tumor metabolisms such as steroid hormone biosynthesis, drug metabolism cytochrome P450, and retinol metabolism. The CIS consisted of nine hub genes with different coefficients. Especially, the IDO1 and THY1 showed a positive correlation with a signature score, reporting as important factors in cancers. IDO1 promotes tumor progression in colorectal, gastric, cervical, and breast cancer [37–40]. Furthermore, Michael Platten et al. reported that IDO1 presents an immunosuppressive effect by participating in regulating L-Tryptophan (Trp) metabolism through the kynurenine pathway (KP) [41]. Remarkably, promising results of IDO1 inhibitors have been reported in some clinical trials. KEYNOTE-252 clinical trial reported that pembrolizumab combined with epacadostat, an IDO1 selective inhibitor showed promising anti-tumor activity in advanced melanoma [42]. However, large-size randomized clinical trials were needed for investigating the efficacy of IDO1 inhibitors in TNBC [39]. THY1, also known as CD90, has been reported to be correlated with poor prognosis of multiple cancers [43, 44]. Especially, THY1 was found to be implicated in immune cell infiltration in metastatic breast cancer [45]. The pro-tumor effects of both two oncogenes were validated in our study by comparing their expression between normal samples and four subtypes of breast cancer. The results suggested a significantly different expression in TNBC. The qRT-PCR and IHC provided experimental evidence at the mRNA and protein level of IDO1 and THY1 which might help to investigate the underlying regulatory mechanism of these two biomarkers in TNBC.
In conclusion, our study confirmed two distinct clusters according to the cuproptosis-related gene expression that presented close interaction with immune response. We constructed a robust prognostic signature CIS was established to predict overall survival, and systematically assess its association with the immune cell infiltration and immune checkpoint gene expression in TNBC patients with different, which helps to distinguish the immunophenotype of the tumor and predict the efficacy of immunotherapies. What’s more, our cuproptosis and immune-related signature could be used to identify potential sensitive therapeutic agents for TNBC patients who might benefit less from immunotherapy, and provide potential molecular targets to improve the treatment efficacy of ICBs and development of precise therapy strategies in TNBC.
Materials and Methods
Data acquisition and processing
The clinicopathological information and mRNA expression data of TNBC were downloaded from The Cancer Genome Atlas TCGA (https://portal.gdc.cancer.gov/) and set as the training cohort. The data of GSE81540, GSE58812 and GSE188600 GSE58812 and GSE188600 were downloaded from the GEO database (https://www.ncbi.nlm.nih.gov/geo/) using the “getGEO” function in the “GEOquery” R package. Log2 transformations were performed for all gene expression data. Somatic mutation and copy number variation (CNV) data were obtained from the TCGA database. A total of 156 patients from the TCGA-TNBC cohort were included in the training set, and 360 TNBC patients from the GSE81540 cohort were enrolled in the validation set. Cuproptosis-related genes were obtained from previous studies [21].
Consensus clustering
Cluster analysis was performed using the “ConsensusClusterPlus” R package, using a gglomerative pam clustering with a 1-pearson correlation distance and resampling 80% of the samples for 10 repetitions. The optimal number of clusters was determined using the empirical cumulative distribution function plot. In this study, the TNBC patients were divided into 2 clusters based on the gene expression level of 12 cuproptosis-related genes. In detail, we used the consensus clustering algorithm with 1,000 iterations by sampling 80% of the data in each iteration. Two cuproptosis clusters (namely, “cluster A” and “cluster B” groups) were distinguished to present different cuproptosis statuses.
The TNBC cells divided into 7 clusters through UMAP analysis by using “Seurat” R package.
Construction and validation of CIS scoring model
Firstly, we perform univariate Cox regression analysis to assess the prognostic value of 20 cuproptosis and immune-related genes (CIRGs) and visualized it by a forest plot. Then, LASSO-Cox regression was used to screen 9 hub genes and obtain corresponding coefficients for constructing the cuproptosis-associated immune signature CIS signature by using the R package “glmnet”. The calculation formula for the CIS risk score is shown below:
Where xi is the mRNA expression level of each gene and Coefi is the corresponding coefficient. The CIS score was calculated for all patients according to the formula: Riskscore = (-0.3088)*CLEC4E + (-0.1055)*IDO1 + (-0.194)*GBP1 + (-0.1523)*APOBEC3C + (0.2277)*TAP1 + (-0.1583)*C1R + (-0.1891)*RAB2B + (0.6039)*THY1 + (-0.7136)*GPLD. We assessed the reliability of the risk score model by predicting the OS of TNBC through survival curves of both the train set and validation set. The cut-off value of the CIS score was selected as the median risk score of all the patients, and the patients were divided into two risk groups (low-CIS and high-CIS) according to the cut-off value.
Functional annotation and immune cell infiltration analysis
The Gene Ontology (GO), REACTOME, and Kyoto Encyclopedia of Genes and Genomes (KEGG) enrichment in each TNBC sample were analyzed with the “ClusterProfiler” R package. Gene set enrichment analysis (GSEA) was applied to explore significantly correlated pathways in this study.
The CIBERSORT, MCPcounter, xCell, EPIC, and quantiseq algorithms were used to assess the immune cell infiltration of high- and low-CIS groups. The ESTIMATE (The Estimation of Stromal and Immune cells in Malignant Tumor tissues using Expression) method was used to calculate the estimate score, immune score, stromal score, and tumor purity of each TNBC sample. The genes from immune-related signatures summarized in “IOBR” R package published in previous studies were included in our study to evaluated the immune phenotype of TNBC patient. The signatures related to tumor metabolism were also measured by IOBR package via ssGSEA method [21].
Prediction of potential therapeutic agents and immunotherapy response
To predict the potential therapeutic drugs for TNBC patients in high- and low-CIS groups, two datasets (Cancer Therapeutics Response Portal (CTRP) 2.0 database (http://portals.broadinstitute.org/ctrp/) and the Profiling Relative Inhibition Simultaneously in Mixtures (PRISM) database (https://www.theprismlab.org/)) were used to obtain sensitive data. The AUC was used in the two datasets as a standard value for the evaluation of drug sensitivity, with a lower AUC value indicating better drug sensitivity. The drug sensitivity of each sample was predicted by the “pRophetic” package by calculating the AUC value of each compound in every TNBC sample. The correlation between the CIS score and the AUC of each drug was calculated, potentially sensitive agents were screened based on the relationship between AUC and CIS with the criterion of Spearman r > 0.3, and components with significantly different AUC values between the high- and low- CIS groups. Potential responses to immunotherapies (anti-PD1 and anti-CTLA4) of high- and low-risk groups were predicted by the Tumor Immune Dysfunction and Exclusion (TIDE) online Tool (http://tide.dfci.harvard.edu/) and Subclass Mapping method (https://cloud.genepattern.org/gp).
qRT-PCR assays
Total RNA was extracted from TNBC cells by RNAiso Plus (TaKaRa, Kyoto, Japan). The PrimeScript® RT Master Mix Perfect Real Time kit Q12 (TAKARA) was used to reverse transcription. PCR amplifications were performed with the SYBR PremixEx Taq II (TAKARA) and Bio-Rad system according to manufacturers’ protocols. All the primer pairs used in qRT-PCR were listed in Supplementary Table 3.
Immunohistochemistry staining
We collected 20 pairs of paraffin-embedded TNBC tissues and adjacent normal tissues from Peking University Cancer Hospital, and this study has been approved by the Ethics committees of Peking University Cancer Hospital. The TNBC tissues and adjacent normal breast tissues were fixed with 10% formalin, embedded by paraffin, and sectioned. After heating in tris-EDTA buffer, we blocked slides using 5% goat serum and incubated slides with primary antibody (anti-IDO1 [1:100 dilution, Cat No.: 13268-1-AP, Proteintech, China], anti-THY1/CD90 [1: 500 dilution, Cat No.: 66766-1-Ig, Proteintech, China]) at 4° C overnight. Then, the slides were incubated with a secondary antibody. The sections were scanned to obtain high-resolution digital images using a 3DHISTECH scanner (Pannoramic, Taipei). Protein expression levels were evaluated semi-quantitatively following the Allred scoring system guidelines and scored separately by two qualified pathologists [46].
Statistical analysis
In the present experiment, all statistical analysis was conducted by R 4.3. The Wilcoxon test and the Kruska-Wallis test were used for comparisons between two independent samples and comparisons among multiple samples for nonparametric data, respectively. The t-test was used for parametric data. P-value < 0.05 was considered statistically significant. Related R packages including “ggplot2”, “ggpubr”, “survival”, “survminer” and other related R packages were downloaded from Bioconductor packages or R packages.
Data availability statement
The datasets presented in this study can be found in online repositories. The names of the repository/repositories and accession number(s) can be found in the article/Supplementary Material.
Author Contributions
Xi Shen and Jianxin Zhong designed and constructed this study. Xi Shen performed the data analysis and figures plotted. Jianxin Zhong wrote and did the Immunohistochemistry staining. Nianyong Chen was responsible for the data acquisition and critical reading of the manuscript. All authors read and approved the final manuscript.
Conflicts of Interest
The authors declare that the research was conducted in the absence of any commercial or financial relationships that could be construed as a potential conflict of interest.
Ethical Statement and Consent
The studies involving human participants were reviewed and approved by the Ethics committees of Peking University Cancer Hospital. All patients signed a written informed consent before participating in this study.
Funding
This research was supported by the Key Research and Development Project of the Science and Technology Department of Sichuan Province. Grant number: 00402053A2231.
References
- 1. Sung H, Ferlay J, Siegel RL, Laversanne M, Soerjomataram I, Jemal A, Bray F. Global Cancer Statistics 2020: GLOBOCAN Estimates of Incidence and Mortality Worldwide for 36 Cancers in 185 Countries. CA Cancer J Clin. 2021; 71:209–49. https://doi.org/10.3322/caac.21660 [PubMed]
- 2. Yin L, Duan JJ, Bian XW, Yu SC. Triple-negative breast cancer molecular subtyping and treatment progress. Breast Cancer Res. 2020; 22:61. https://doi.org/10.1186/s13058-020-01296-5 [PubMed]
- 3. Li X, Yang J, Peng L, Sahin AA, Huo L, Ward KC, O’Regan R, Torres MA, Meisel JL. Triple-negative breast cancer has worse overall survival and cause-specific survival than non-triple-negative breast cancer. Breast Cancer Res Treat. 2017; 161:279–87. https://doi.org/10.1007/s10549-016-4059-6 [PubMed]
- 4. Yersal O, Barutca S. Biological subtypes of breast cancer: Prognostic and therapeutic implications. World J Clin Oncol. 2014; 5:412–24. https://doi.org/10.5306/wjco.v5.i3.412 [PubMed]
- 5. Carlino F, Diana A, Piccolo A, Ventriglia A, Bruno V, De Santo I, Letizia O, De Vita F, Daniele B, Ciardiello F, Orditura M. Immune-Based Therapy in Triple-Negative Breast Cancer: From Molecular Biology to Clinical Practice. Cancers (Basel). 2022; 14:2102. https://doi.org/10.3390/cancers14092102 [PubMed]
- 6. Zhu Y, Zhu X, Tang C, Guan X, Zhang W. Progress and challenges of immunotherapy in triple-negative breast cancer. Biochim Biophys Acta Rev Cancer. 2021; 1876:188593. https://doi.org/10.1016/j.bbcan.2021.188593 [PubMed]
- 7. Chen L, Min J, Wang F. Copper homeostasis and cuproptosis in health and disease. Signal Transduct Target Ther. 2022; 7:378. https://doi.org/10.1038/s41392-022-01229-y [PubMed]
- 8. Theophanides T, Anastassopoulou J. Copper and carcinogenesis. Crit Rev Oncol Hematol. 2002; 42:57–64. https://doi.org/10.1016/s1040-8428(02)00007-0 [PubMed]
- 9. Ge EJ, Bush AI, Casini A, Cobine PA, Cross JR, DeNicola GM, Dou QP, Franz KJ, Gohil VM, Gupta S, Kaler SG, Lutsenko S, Mittal V, et al. Connecting copper and cancer: from transition metal signalling to metalloplasia. Nat Rev Cancer. 2022; 22:102–13. https://doi.org/10.1038/s41568-021-00417-2 [PubMed]
- 10. Ash D, Sudhahar V, Youn SW, Okur MN, Das A, O’Bryan JP, McMenamin M, Hou Y, Kaplan JH, Fukai T, Ushio-Fukai M. The P-type ATPase transporter ATP7A promotes angiogenesis by limiting autophagic degradation of VEGFR2. Nat Commun. 2021; 12:3091. https://doi.org/10.1038/s41467-021-23408-1 [PubMed]
- 11. Li X, Ma Z, Mei L. Cuproptosis-related gene SLC31A1 is a potential predictor for diagnosis, prognosis and therapeutic response of breast cancer. Am J Cancer Res. 2022; 12:3561–80. [PubMed]
- 12. Wang L, Cao Y, Guo W, Xu J. High expression of cuproptosis-related gene FDX1 in relation to good prognosis and immune cells infiltration in colon adenocarcinoma (COAD). J Cancer Res Clin Oncol. 2023; 149:15–24. https://doi.org/10.1007/s00432-022-04382-7 [PubMed]
- 13. Wang T, Liu Y, Li Q, Luo Y, Liu D, Li B. Cuproptosis-related gene FDX1 expression correlates with the prognosis and tumor immune microenvironment in clear cell renal cell carcinoma. Front Immunol. 2022; 13:999823. https://doi.org/10.3389/fimmu.2022.999823 [PubMed]
- 14. Kumagai S, Togashi Y, Kamada T, Sugiyama E, Nishinakamura H, Takeuchi Y, Vitaly K, Itahashi K, Maeda Y, Matsui S, Shibahara T, Yamashita Y, Irie T, et al. The PD-1 expression balance between effector and regulatory T cells predicts the clinical efficacy of PD-1 blockade therapies. Nat Immunol. 2020; 21:1346–58. https://doi.org/10.1038/s41590-020-0769-3 [PubMed]
- 15. Asrir A, Tardiveau C, Coudert J, Laffont R, Blanchard L, Bellard E, Veerman K, Bettini S, Lafouresse F, Vina E, Tarroux D, Roy S, Girault I, et al. Tumor-associated high endothelial venules mediate lymphocyte entry into tumors and predict response to PD-1 plus CTLA-4 combination immunotherapy. Cancer Cell. 2022; 40:318–34.e9. https://doi.org/10.1016/j.ccell.2022.01.002 [PubMed]
- 16. Paijens ST, Vledder A, de Bruyn M, Nijman HW. Tumor-infiltrating lymphocytes in the immunotherapy era. Cell Mol Immunol. 2021; 18:842–59. https://doi.org/10.1038/s41423-020-00565-9 [PubMed]
- 17. Xiao Y, Yu D. Tumor microenvironment as a therapeutic target in cancer. Pharmacol Ther. 2021; 221:107753. https://doi.org/10.1016/j.pharmthera.2020.107753 [PubMed]
- 18. Bardia A, Mayer IA, Diamond JR, Moroose RL, Isakoff SJ, Starodub AN, Shah NC, O’Shaughnessy J, Kalinsky K, Guarino M, Abramson V, Juric D, Tolaney SM, et al. Efficacy and Safety of Anti-Trop-2 Antibody Drug Conjugate Sacituzumab Govitecan (IMMU-132) in Heavily Pretreated Patients With Metastatic Triple-Negative Breast Cancer. J Clin Oncol. 2017; 35:2141–8. https://doi.org/10.1200/JCO.2016.70.8297 [PubMed]
- 19. Bardia A, Mayer IA, Vahdat LT, Tolaney SM, Isakoff SJ, Diamond JR, O’Shaughnessy J, Moroose RL, Santin AD, Abramson VG, Shah NC, Rugo HS, Goldenberg DM, et al. Sacituzumab Govitecan-hziy in Refractory Metastatic Triple-Negative Breast Cancer. N Engl J Med. 2019; 380:741–51. https://doi.org/10.1056/NEJMoa1814213 [PubMed]
- 20. Ferrari P, Scatena C, Ghilli M, Bargagna I, Lorenzini G, Nicolini A. Molecular Mechanisms, Biomarkers and Emerging Therapies for Chemotherapy Resistant TNBC. Int J Mol Sci. 2022; 23:1665. https://doi.org/10.3390/ijms23031665 [PubMed]
- 21. Zeng D, Ye Z, Shen R, Yu G, Wu J, Xiong Y, Zhou R, Qiu W, Huang N, Sun L, Li X, Bin J, Liao Y, et al. IOBR: Multi-Omics Immuno-Oncology Biological Research to Decode Tumor Microenvironment and Signatures. Front Immunol. 2021; 12:687975. https://doi.org/10.3389/fimmu.2021.687975 [PubMed]
- 22. Chen J, Jiang Y, Shi H, Peng Y, Fan X, Li C. The molecular mechanisms of copper metabolism and its roles in human diseases. Pflugers Arch. 2020; 472:1415–29. https://doi.org/10.1007/s00424-020-02412-2 [PubMed]
- 23. Voli F, Valli E, Lerra L, Kimpton K, Saletta F, Giorgi FM, Mercatelli D, Rouaen JR, Shen S, Murray JE, Ahmed-Cox A, Cirillo G, Mayoh C, et al. Intratumoral Copper Modulates PD-L1 Expression and Influences Tumor Immune Evasion. Cancer Res. 2020; 80:4129–44. https://doi.org/10.1158/0008-5472.CAN-20-0471 [PubMed]
- 24. Xie J, Yang Y, Gao Y, He J. Cuproptosis: mechanisms and links with cancers. Mol Cancer. 2023; 22:46. https://doi.org/10.1186/s12943-023-01732-y [PubMed]
- 25. Cui L, Gouw AM, LaGory EL, Guo S, Attarwala N, Tang Y, Qi J, Chen YS, Gao Z, Casey KM, Bazhin AA, Chen M, Hu L, et al. Mitochondrial copper depletion suppresses triple-negative breast cancer in mice. Nat Biotechnol. 2021; 39:357–67. https://doi.org/10.1038/s41587-020-0707-9 [PubMed]
- 26. Duan F, Li J, Huang J, Hua X, Song C, Wang L, Bi X, Xia W, Yuan Z. Establishment and Validation of Prognostic Nomograms Based on Serum Copper Level for Patients With Early-Stage Triple-Negative Breast Cancer. Front Cell Dev Biol. 2021; 9:770115. https://doi.org/10.3389/fcell.2021.770115 [PubMed]
- 27. Tsvetkov P, Coy S, Petrova B, Dreishpoon M, Verma A, Abdusamad M, Rossen J, Joesch-Cohen L, Humeidi R, Spangler RD, Eaton JK, Frenkel E, Kocak M, et al. Copper induces cell death by targeting lipoylated TCA cycle proteins. Science. 2022; 375:1254–61. https://doi.org/10.1126/science.abf0529 [PubMed]
- 28. Li W, Wang X, Li C, Chen T, Zhou X, Li Z, Yang Q. Identification and validation of an m6A-related gene signature to predict prognosis and evaluate immune features of breast cancer. Hum Cell. 2023; 36:393–408. https://doi.org/10.1007/s13577-022-00826-x [PubMed]
- 29. Zhang L, Liu C, Zhang X, Wang C, Liu D. Breast cancer prognosis and immunological characteristics are predicted using the m6A/m5C/m1A/m7G-related long noncoding RNA signature. Funct Integr Genomics. 2023; 23:117. https://doi.org/10.1007/s10142-023-01026-y [PubMed]
- 30. Zou Y, Xie J, Zheng S, Liu W, Tang Y, Tian W, Deng X, Wu L, Zhang Y, Wong CW, Tan D, Liu Q, Xie X. Leveraging diverse cell-death patterns to predict the prognosis and drug sensitivity of triple-negative breast cancer patients after surgery. Int J Surg. 2022; 107:106936. https://doi.org/10.1016/j.ijsu.2022.106936 [PubMed]
- 31. Keenan TE, Tolaney SM. Role of Immunotherapy in Triple-Negative Breast Cancer. J Natl Compr Canc Netw. 2020; 18:479–89. https://doi.org/10.6004/jnccn.2020.7554 [PubMed]
- 32. Emens LA, Adams S, Barrios CH, Diéras V, Iwata H, Loi S, Rugo HS, Schneeweiss A, Winer EP, Patel S, Henschel V, Swat A, Kaul M, et al. First-line atezolizumab plus nab-paclitaxel for unresectable, locally advanced, or metastatic triple-negative breast cancer: IMpassion130 final overall survival analysis. Ann Oncol. 2021; 32:983–93. https://doi.org/10.1016/j.annonc.2021.05.355 [PubMed]
- 33. Miles D, Gligorov J, André F, Cameron D, Schneeweiss A, Barrios C, Xu B, Wardley A, Kaen D, Andrade L, Semiglazov V, Reinisch M, Patel S, et al, and IMpassion131 investigators. Primary results from IMpassion131, a double-blind, placebo-controlled, randomised phase III trial of first-line paclitaxel with or without atezolizumab for unresectable locally advanced/metastatic triple-negative breast cancer. Ann Oncol. 2021; 32:994–1004. https://doi.org/10.1016/j.annonc.2021.05.801 [PubMed]
- 34. Gibney GT, Weiner LM, Atkins MB. Predictive biomarkers for checkpoint inhibitor-based immunotherapy. Lancet Oncol. 2016; 17:e542–51. https://doi.org/10.1016/S1470-2045(16)30406-5 [PubMed]
- 35. Rizzo A, Ricci AD. Biomarkers for breast cancer immunotherapy: PD-L1, TILs, and beyond. Expert Opin Investig Drugs. 2022; 31:549–55. https://doi.org/10.1080/13543784.2022.2008354 [PubMed]
- 36. Chen H, Yang W, Ji Z. Machine learning-based identification of tumor-infiltrating immune cell-associated model with appealing implications in improving prognosis and immunotherapy response in bladder cancer patients. Front Immunol. 2023; 14:1171420. https://doi.org/10.3389/fimmu.2023.1171420 [PubMed]
- 37. Shi D, Wu X, Jian Y, Wang J, Huang C, Mo S, Li Y, Li F, Zhang C, Zhang D, Zhang H, Huang H, Chen X, et al. USP14 promotes tryptophan metabolism and immune suppression by stabilizing IDO1 in colorectal cancer. Nat Commun. 2022; 13:5644. https://doi.org/10.1038/s41467-022-33285-x [PubMed]
- 38. Toulmonde M, Penel N, Adam J, Chevreau C, Blay JY, Le Cesne A, Bompas E, Piperno-Neumann S, Cousin S, Grellety T, Ryckewaert T, Bessede A, Ghiringhelli F, et al. Use of PD-1 Targeting, Macrophage Infiltration, and IDO Pathway Activation in Sarcomas: A Phase 2 Clinical Trial. JAMA Oncol. 2018; 4:93–7. https://doi.org/10.1001/jamaoncol.2017.1617 [PubMed]
- 39. Wei JL, Wu SY, Yang YS, Xiao Y, Jin X, Xu XE, Hu X, Li DQ, Jiang YZ, Shao ZM. GCH1 induces immunosuppression through metabolic reprogramming and IDO1 upregulation in triple-negative breast cancer. J Immunother Cancer. 2021; 9:e002383. https://doi.org/10.1136/jitc-2021-002383 [PubMed]
- 40. Yang SL, Tan HX, Niu TT, Liu YK, Gu CJ, Li DJ, Li MQ, Wang HY. The IFN-γ-IDO1-kynureine pathway-induced autophagy in cervical cancer cell promotes phagocytosis of macrophage. Int J Biol Sci. 2021; 17:339–52. https://doi.org/10.7150/ijbs.51241 [PubMed]
- 41. Platten M, Nollen EAA, Röhrig UF, Fallarino F, Opitz CA. Tryptophan metabolism as a common therapeutic target in cancer, neurodegeneration and beyond. Nat Rev Drug Discov. 2019; 18:379–401. https://doi.org/10.1038/s41573-019-0016-5 [PubMed]
- 42. Long GV, Dummer R, Hamid O, Gajewski TF, Caglevic C, Dalle S, Arance A, Carlino MS, Grob JJ, Kim TM, Demidov L, Robert C, Larkin J, et al. Epacadostat plus pembrolizumab versus placebo plus pembrolizumab in patients with unresectable or metastatic melanoma (ECHO-301/KEYNOTE-252): a phase 3, randomised, double-blind study. Lancet Oncol. 2019; 20:1083–97. https://doi.org/10.1016/S1470-2045(19)30274-8 [PubMed]
- 43. Brenet M, Martínez S, Pérez-Nuñez R, Pérez LA, Contreras P, Díaz J, Avalos AM, Schneider P, Quest AFG, Leyton L. Thy-1 (CD90)-Induced Metastatic Cancer Cell Migration and Invasion Are β3 Integrin-Dependent and Involve a Ca2+/P2X7 Receptor Signaling Axis. Front Cell Dev Biol. 2021; 8:592442. https://doi.org/10.3389/fcell.2020.592442 [PubMed]
- 44. True LD, Zhang H, Ye M, Huang CY, Nelson PS, von Haller PD, Tjoelker LW, Kim JS, Qian WJ, Smith RD, Ellis WJ, Liebeskind ES, Liu AY. CD90/THY1 is overexpressed in prostate cancer-associated fibroblasts and could serve as a cancer biomarker. Mod Pathol. 2010; 23:1346–56. https://doi.org/10.1038/modpathol.2010.122 [PubMed]
- 45. Lobba ARM, Carreira ACO, Cerqueira OLD, Fujita A, DeOcesano-Pereira C, Osorio CAB, Soares FA, Rameshwar P, Sogayar MC. High CD90 (THY-1) expression positively correlates with cell transformation and worse prognosis in basal-like breast cancer tumors. PLoS One. 2018; 13:e0199254. https://doi.org/10.1371/journal.pone.0199254 [PubMed]
- 46. Ahmad Fauzi MF, Wan Ahmad WS, Jamaluddin MF, Lee JTH, Khor SY, Looi LM, Abas FS, Aldahoul N. Allred Scoring of ER-IHC Stained Whole-Slide Images for Hormone Receptor Status in Breast Carcinoma. Diagnostics (Basel). 2022; 12:3093. https://doi.org/10.3390/diagnostics12123093 [PubMed]