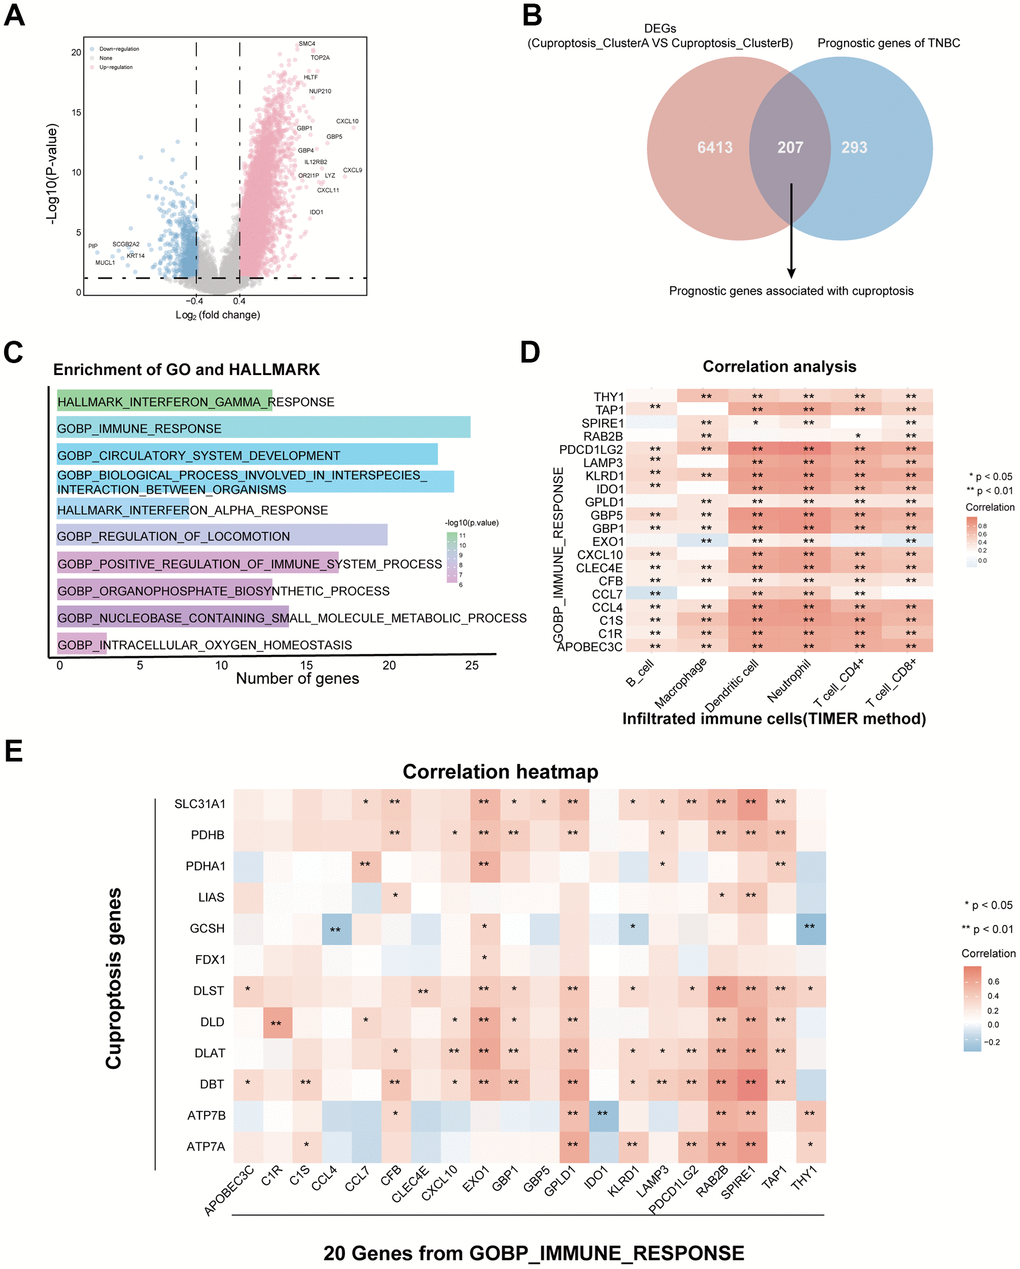
Figure 3.Identification of cuproptosis and immune-related genes in TNBC. (A) Volcano plot exhibiting the differentially expressed genes (DEGs) between the two cuproptosis clusters. (B) Screening 207 prognosis DEGs through the intersection of DEGs and prognostic genes in TNBC. (C) Enrichment analysis with GO and HALLMARK pathways based on 207 prognosis DEGs. (D) Identification of 20 prognostic DEGs associated with GO_IMMUNE_RESPONSE and immune infiltrated cells. (E) The correlation heatmap of 20 immune genes with 12 cuproptosis genes. (* P<0.05, **P< 0.01).