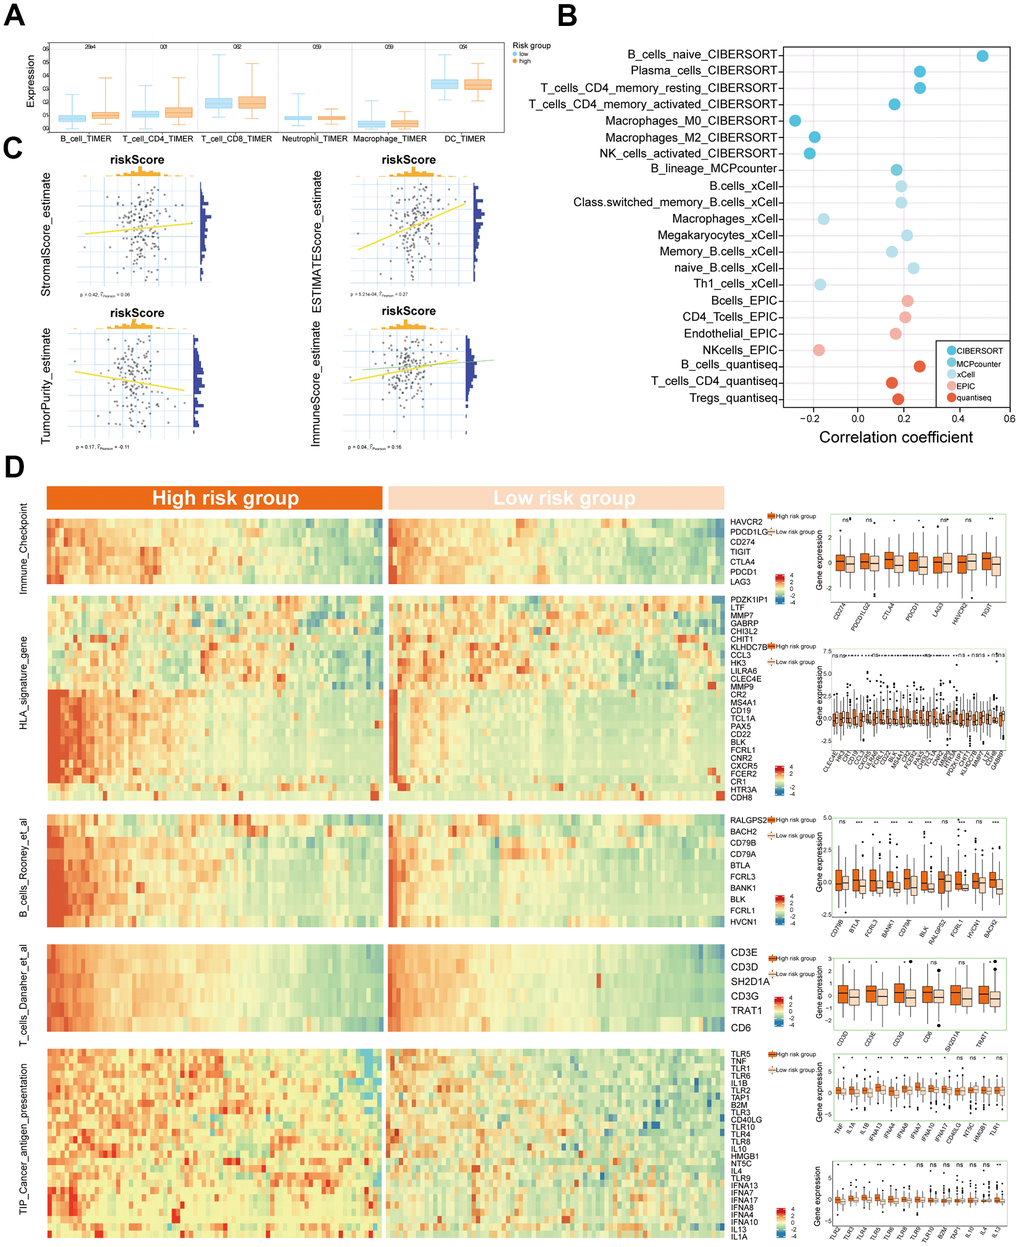
Figure 6.Association between CIS and tumor immune microenvironment. (A) The boxplot of the immune cell infiltration in low- and high-risk groups depending on TIMER estimation. (B) The significant correlation between immune cells and CIS score in CIBERSORT, MCPcounter, xCell, EPIC, and quantiseq analyses. (C) Comparison of the expression of genes from the signatures of Immune_check_point, HLA, B_cells_Rooney_et_al., B_cells_Danaher_et_al., T_cell_Danaher_et_al., and TIP_Cancer_antigen_presentation between low- and high -risk groups in heatmap and boxplot. (D) The correlation between CIS score and ESTIMATE algorithm evaluated scores in TNBC. (*P<0.05, **P< 0.01, ***P< 0.001).