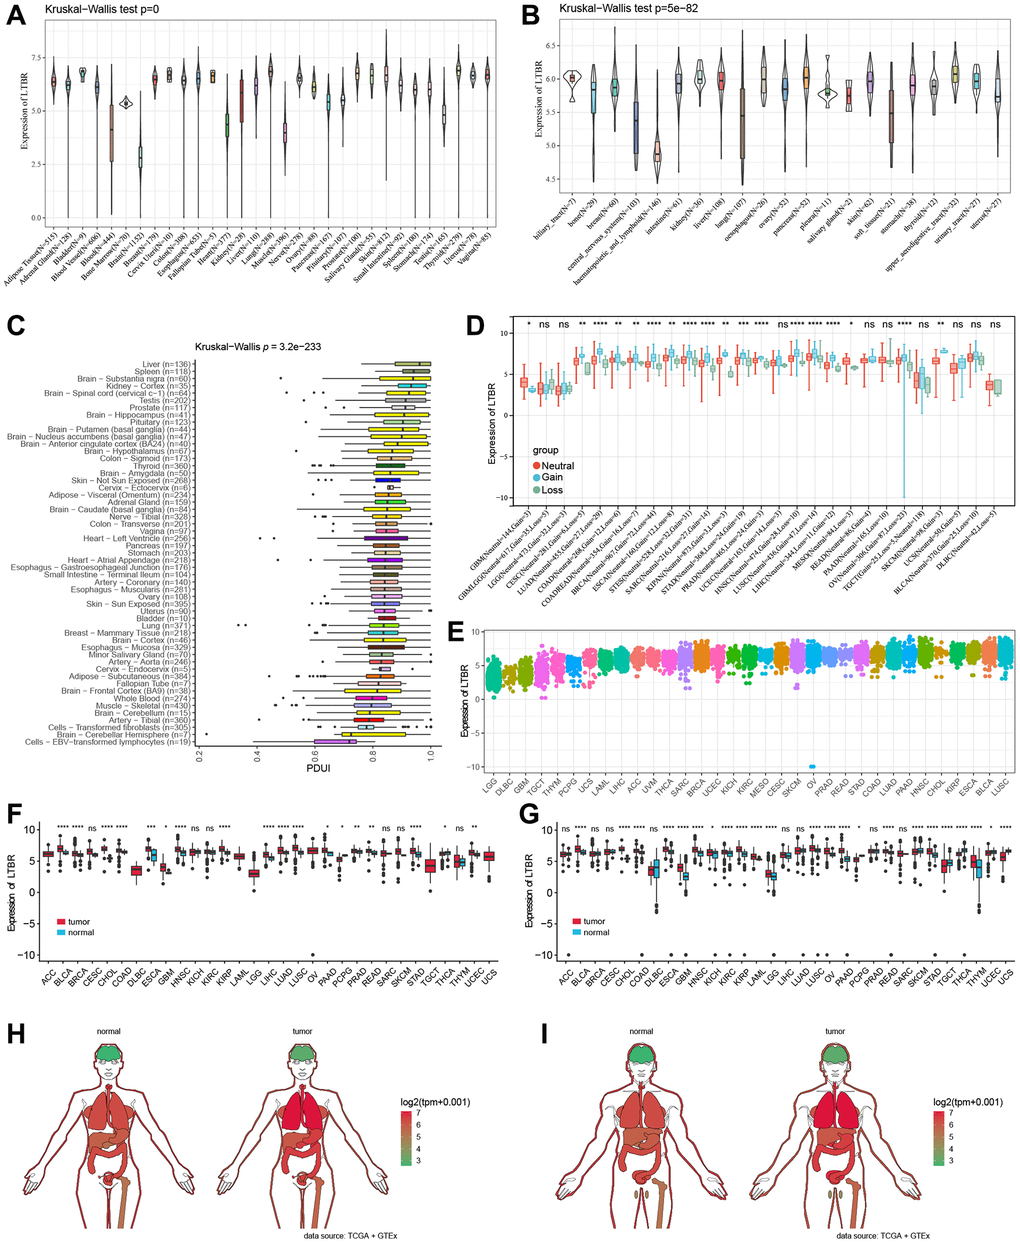
Figure 1.LTBR mRNA expression. (A) LTBR expression in 31 normal tissues and (B) 21 tumor cell lines. (C) APA landscape of LTBR in individual normal tissues. (D) Differential CNV expression levels of LTBR in individual tumors. (E) LTBR mRNA expression in tumor tissues from TCGA database. (F) Expression levels of LTBR in TCGA. (G) Combined GTEx database and TCGA analysis of LTBR expression levels. Anatomical maps of LTBR gene expression profiles in all tumor samples and normal tissues in females (H) and males (I).