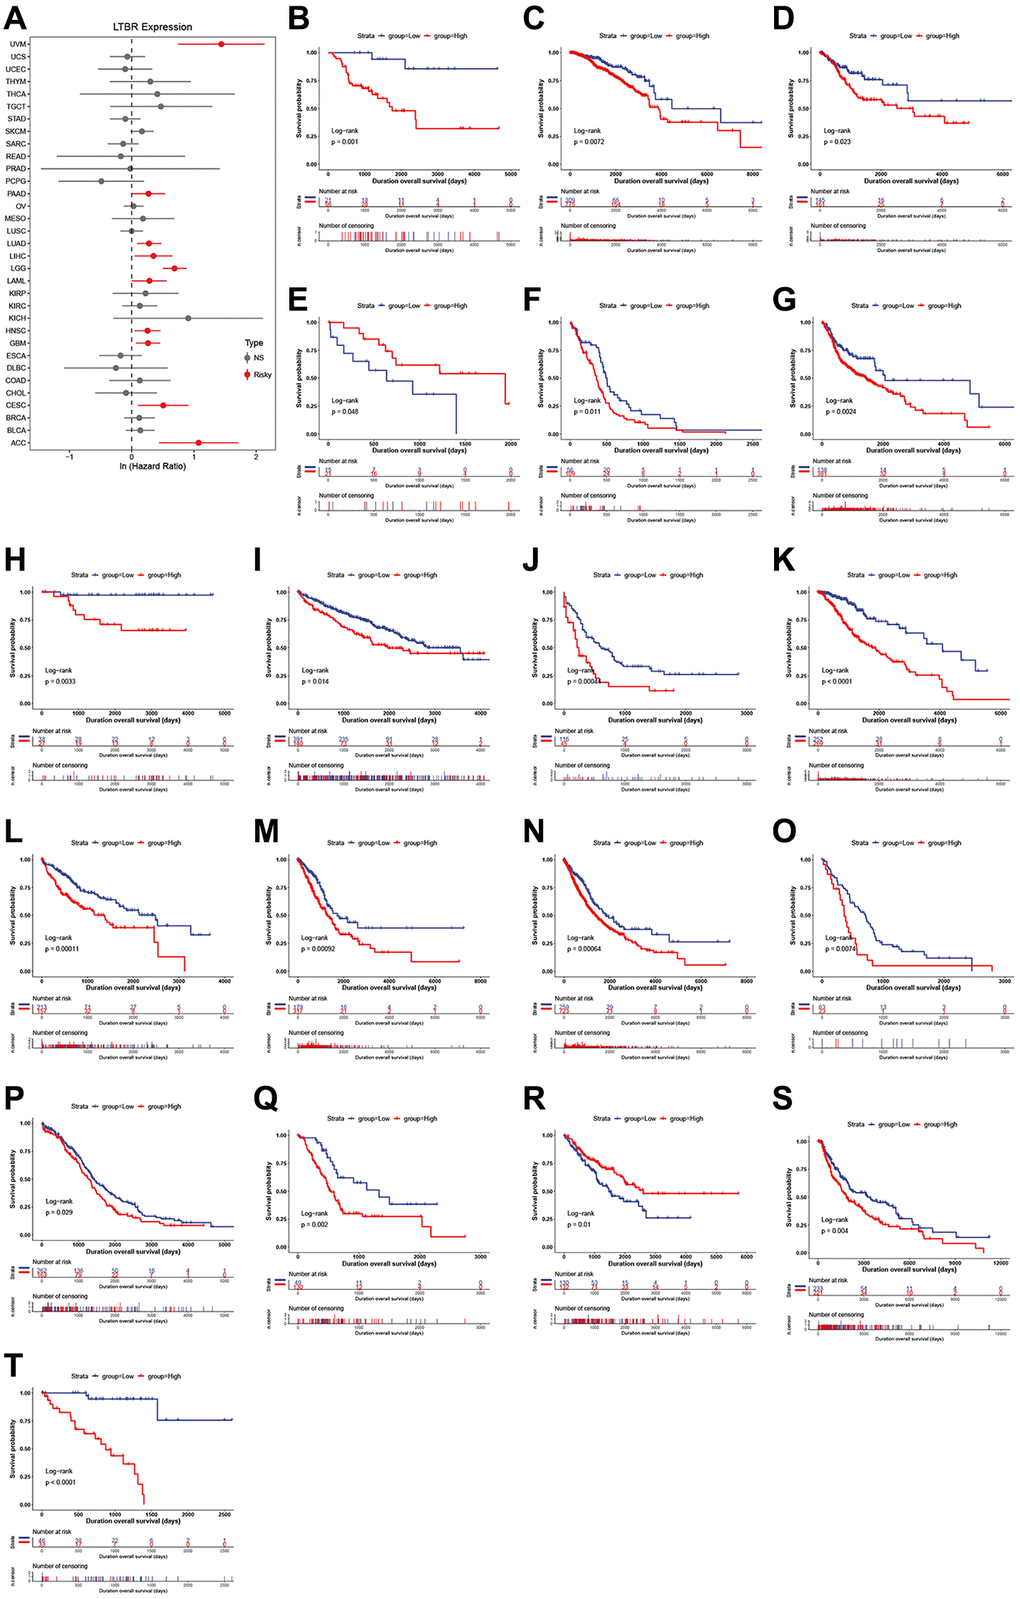
Figure 3.The relationship of LTBR expression with patients’ OS. (A) Forest plots of hazard ratios of LTBR in 33 cancer types. Log-rank test OS curves for patients stratified by different expression levels of LTBR in (B) ACC, (C) BRCA, (D) CESC, (E) CHOL, (F) GBM, (G) HNSC, (H) KICH, (I) KIRC, (J) LAML, (K) LGG, (L) LIHC, (M) LUAD, (N) LUNG, (O) MESO, (P) OV, (Q) PAAD, (R) SARC, (S) SKCM, (T) UVM.