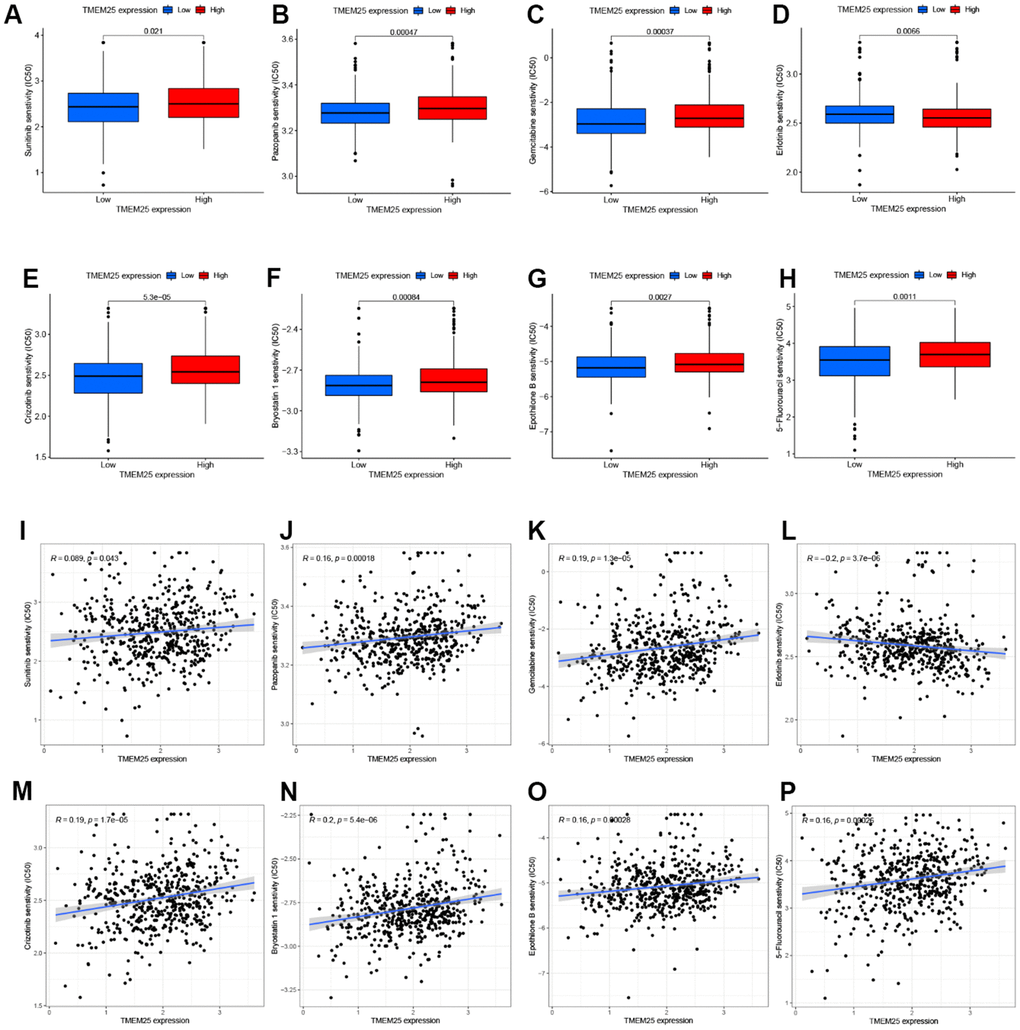
Figure 8.Drug sensitivity analysis of TMEM25 in ccRCC. Based on the median expression value of TMEM25 in ccRCC, the TCGA-KIRC cohort was categorized into high and low expression groups and the respective IC50 values were calculated, and the drug sensitivity was demonstrated by bar charts (A–H) and scatter plots (I–P).