Submit an Article
Navigate
Home
Editorial Board
Editorial Policies
Current Volume
Archive
Scientific Integrity
Publication Ethics Statements
Interviews with Outstanding Authors
Newsroom
Sponsored Conferences
Podcast
Contact
Special Collections
Submit an Article
Online ISSN: 1945-4589
Research Paper
|
Volume 16, Issue 2
|
pp. 1192–1217
Gut microbial community and fecal metabolomic signatures in different types of osteoporosis animal models
Back to article
Figure 4
(4 of 6)
−
100%
+
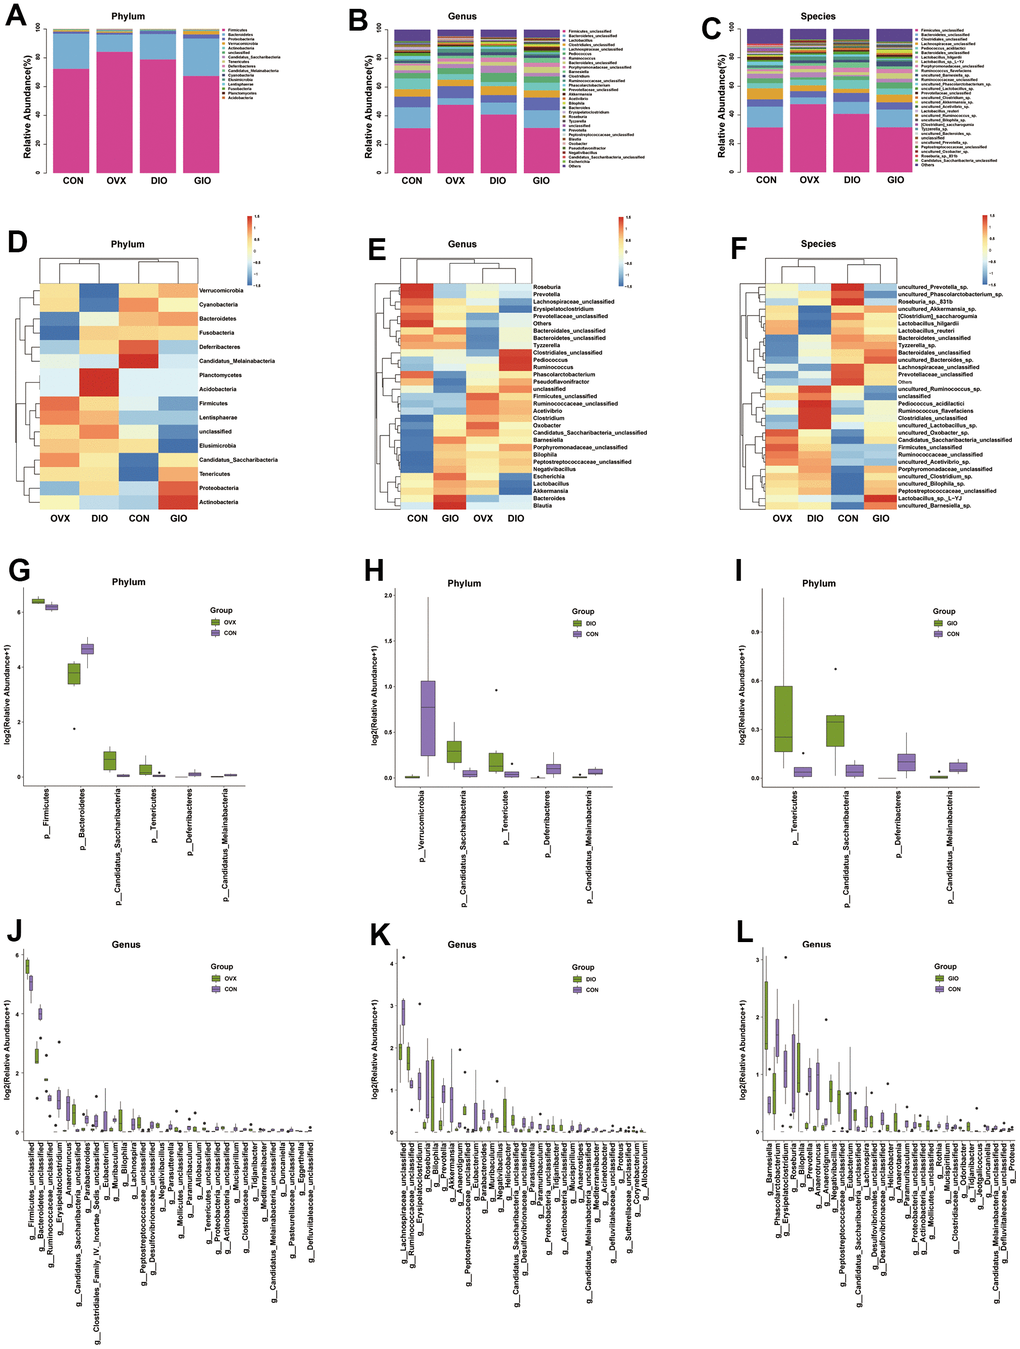
Figure 4.
(
A
–
C
) Stacked bar chart showing bacterial phylum, genus, and species in GM. (
D
–
F
) Heat map showing bacterial phylum, genus, and species. (
G
–
I
) Significant phylum-level GM differences. (
J
–
L
) Significant genus-level GM differences; n = 6.
Figure 4 — Gut microbial community and fecal metabolomic signatures in different types of osteoporosis animal models | Aging