Submit an Article
Navigate
Home
Editorial Board
Editorial Policies
Current Volume
Archive
Scientific Integrity
Publication Ethics Statements
Interviews with Outstanding Authors
Newsroom
Sponsored Conferences
Podcast
Contact
Special Collections
Submit an Article
Online ISSN: 1945-4589
Research Paper
|
Volume 16, Issue 1
|
pp. 648–664
Danggui-Shaoyao-San (DSS) ameliorates the progression of osteoarthritis via suppressing the NF-κB signaling pathway: an
in vitro
and
in vivo
study combined with bioinformatics analysis
Back to article
Figure 3
(3 of 8)
−
100%
+
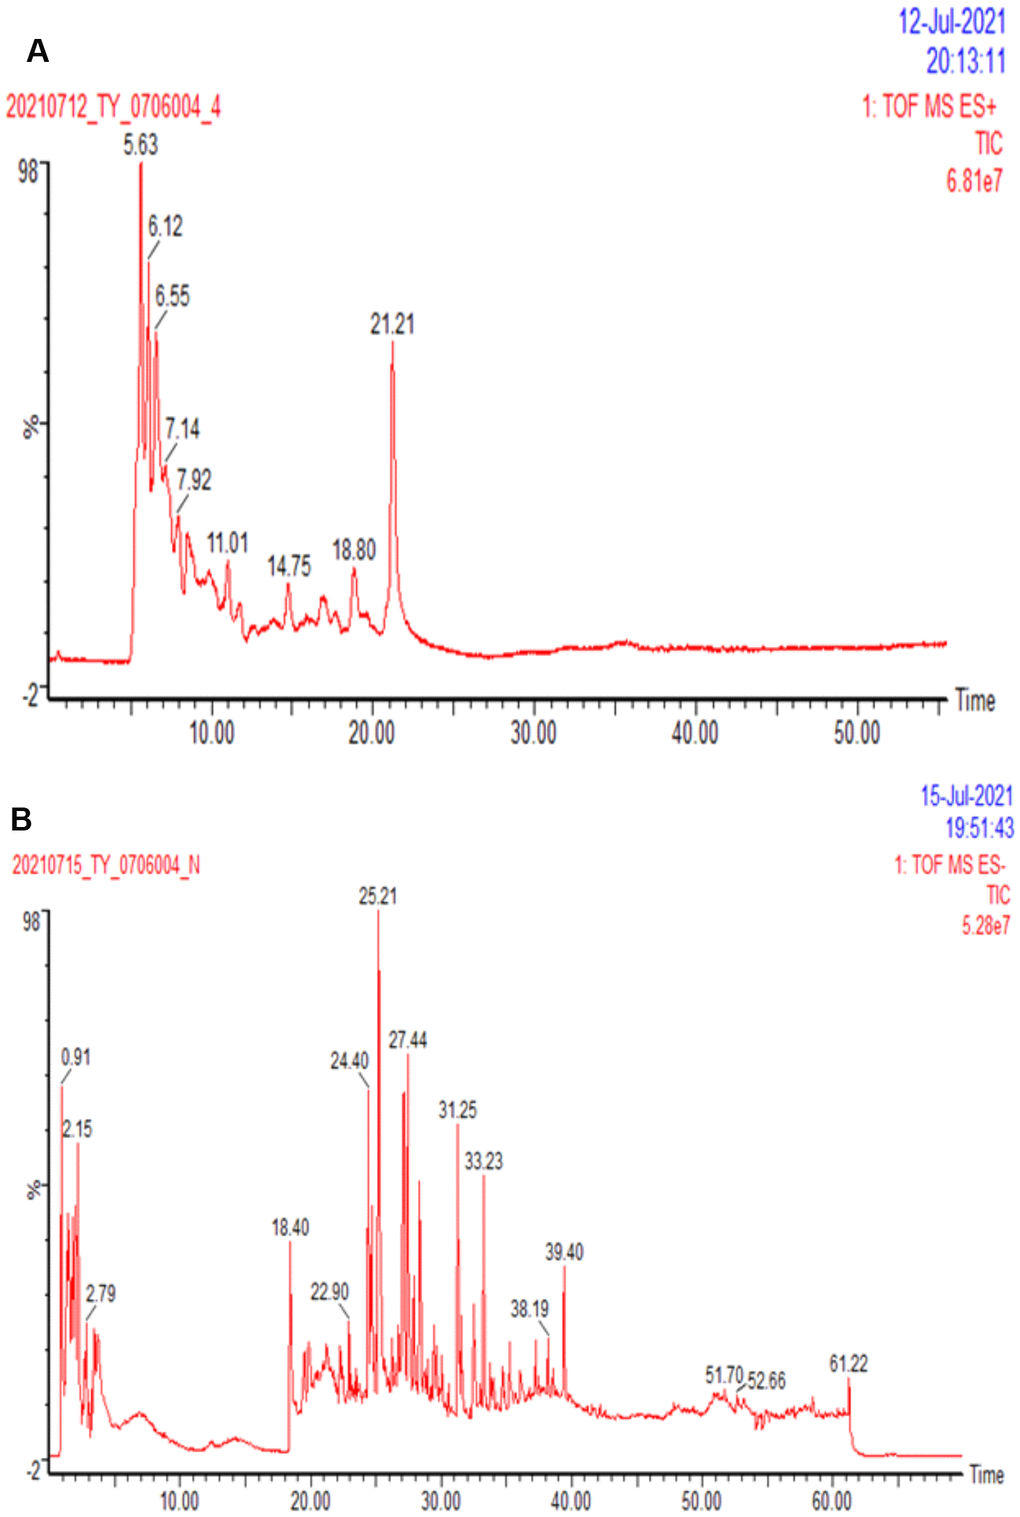
Figure 3.
Ion flow diagram of DSS detected by HPLC.
(
A
) The representative total ion chromatography of sample in positive ion mode. (
B
) The representative total ion chromatography of sample in negative ion mode.