Submit an Article
Navigate
Home
Editorial Board
Editorial Policies
Current Volume
Archive
Scientific Integrity
Publication Ethics Statements
Interviews with Outstanding Authors
Newsroom
Sponsored Conferences
Podcast
Contact
Special Collections
Submit an Article
Online ISSN: 1945-4589
Research Paper
|
Volume 16, Issue 1
|
pp. 799–819
Exploring the causal relationship between inflammatory bowel disease and sarcopenia-related traits: a two-sample Mendelian randomization analysis
Back to article
Figure 5
(5 of 6)
−
100%
+
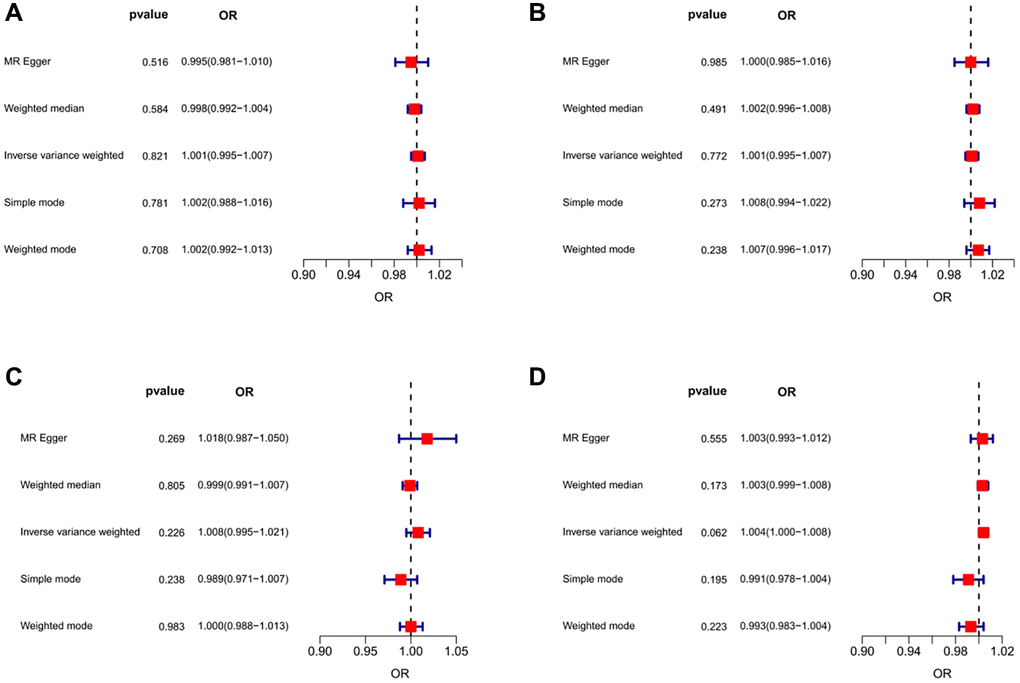
Figure 5.
Forest plots of MR results for assessing the causal effect of UC on sarcopenia.
(
A
) UC-grip strength (left). (
B
) UC-grip strength (right). (
C
) UC-ALM. (
D
) UC-Walking pace.
Figure 5 — Exploring the causal relationship between inflammatory bowel disease and sarcopenia-related traits: a two-sample Mendelian randomization analysis | Aging