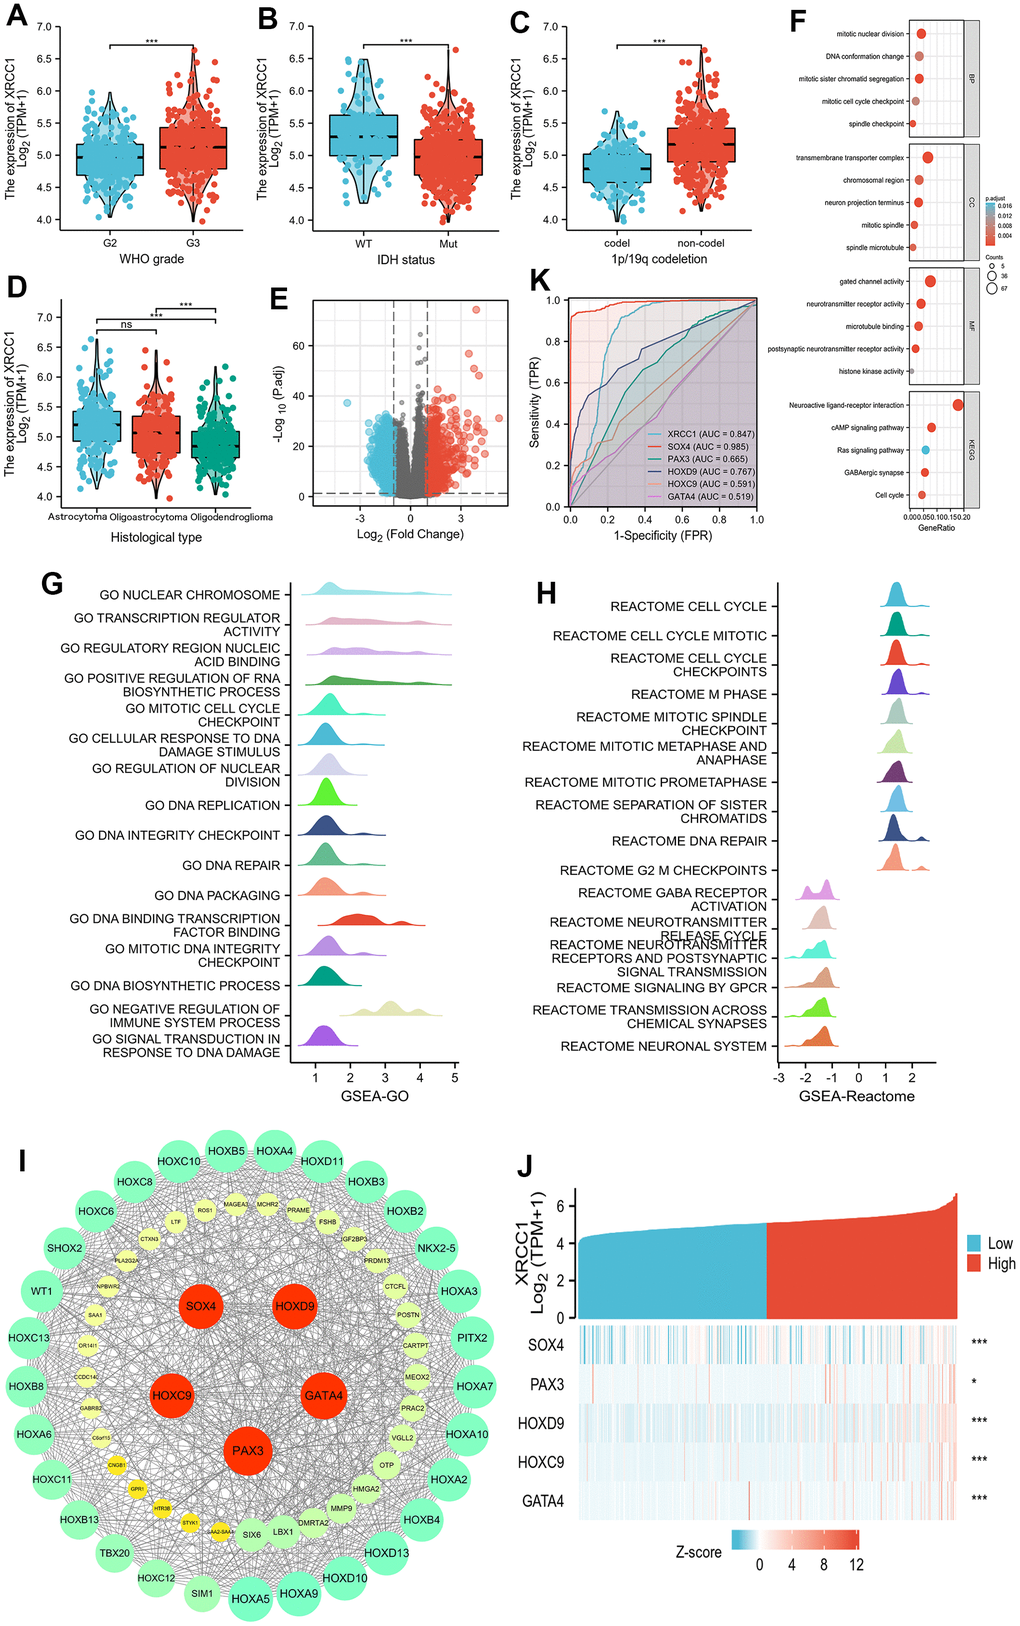
Figure 13.Associations between XRCC1 expression and different clinical characteristics in LGG. PPI network building and GO, KEGG, and GSEA analyses between XRCC1 high and low expression groups in LGG. Hub genes positively correlated with XRCC1 expression in LGG and hub genes' receiver operating characteristic (ROC) curve. (A) WHO grade. (B) IDH status. (C) 1p/19q codeletion. (D) Histological type (ns, p≥0.05, *p<0.05, **p<0.01, ***p<0.001). (E) volcano plot of DEGs (red: upregulation, blue: downregulation). (F) GO and KEGG analyses of DEGs. (G, H) significant GSEA results for DEGs, including GO terms and Reactome pathways. (I) PPI network. (J) the gene coexpression heatmap of the hub genes. (K) ROC curve of hub genes.