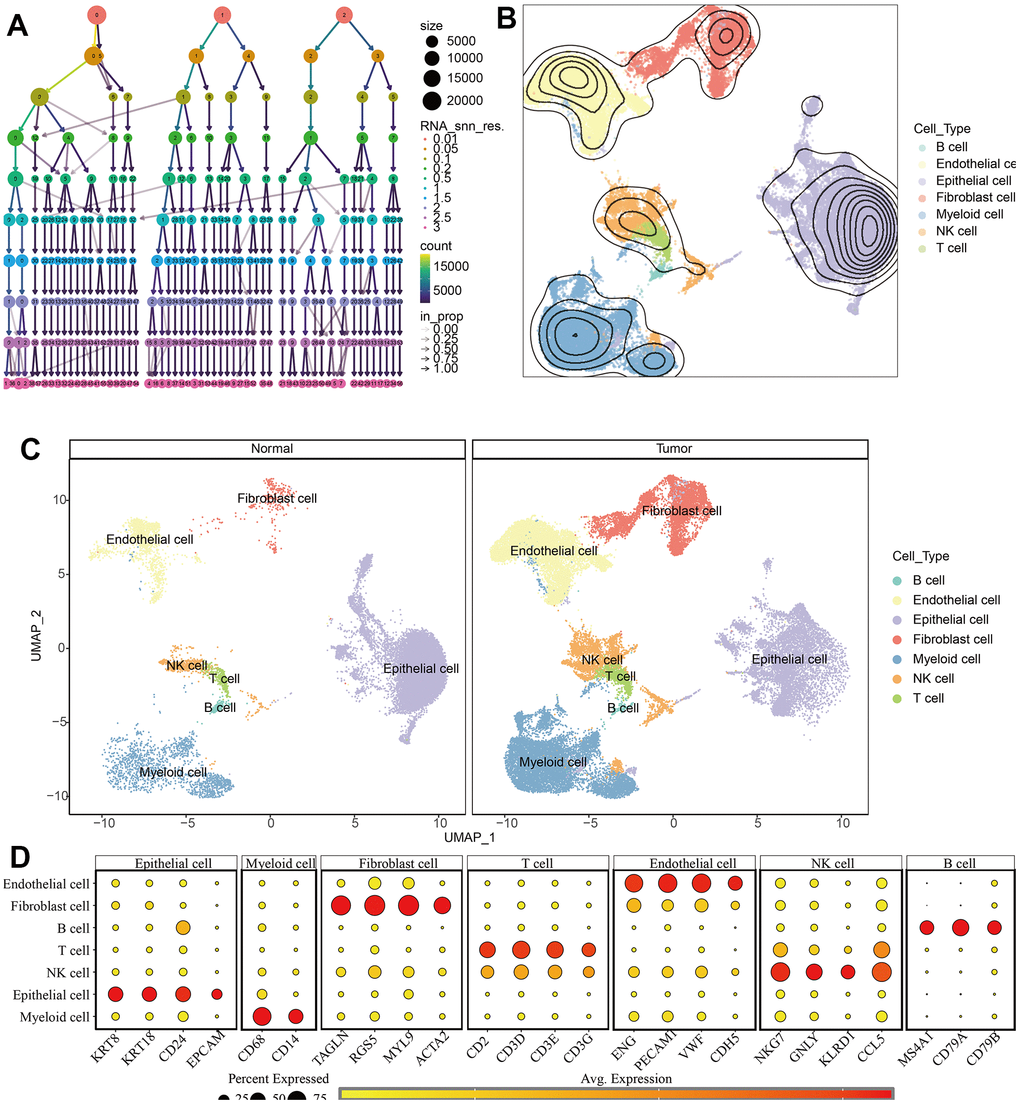
Figure 9.Identification of different cell types in KIRC and normal samples. (A) The clustree for identifying suitable cell clusters. (B) Different types of cells in all samples. (C) Different types of cells in KIRC and normal samples. (D) The expression of marker genes in each cell type.