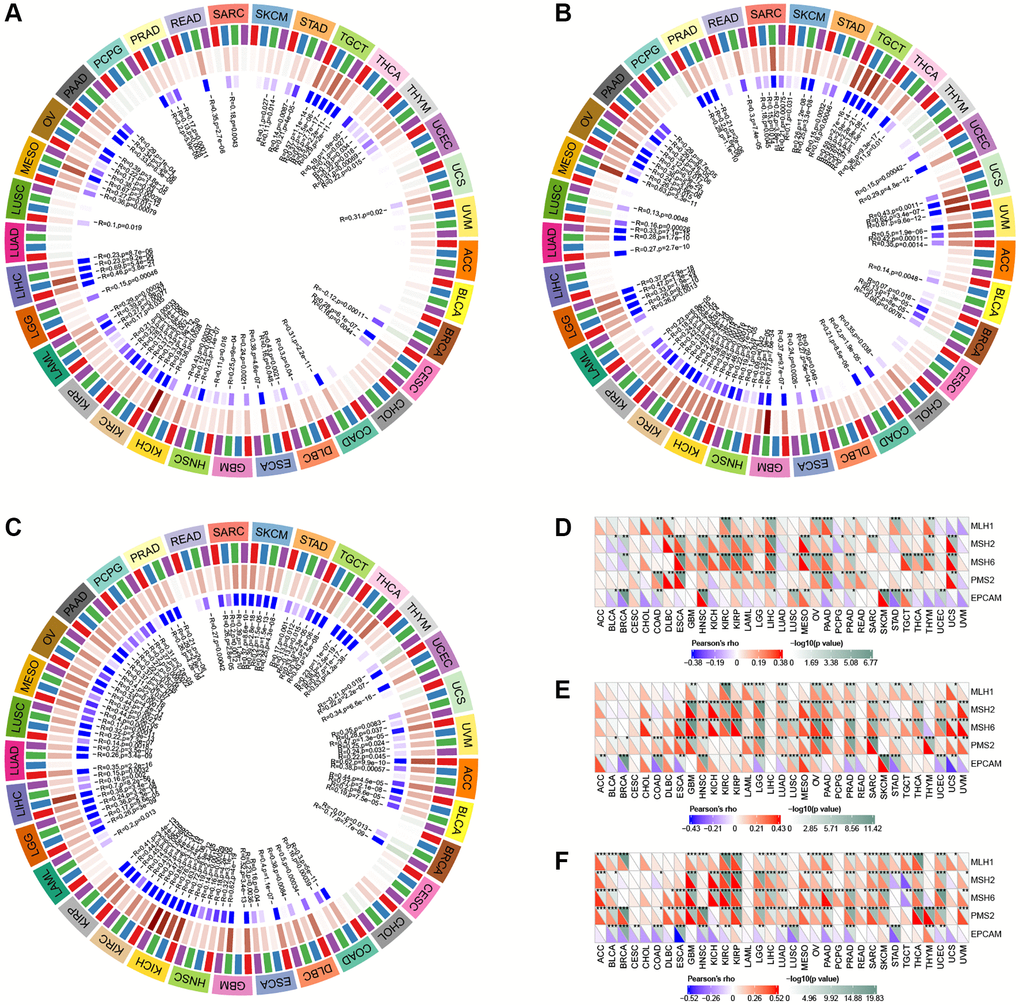
Figure 12.Correlation analysis of GLI1 (A), GLI2 (B), and GLI3 (C) expression with DNA methyltransferases (Red represents DNMAT1, blue represents DNMT2, green represents DNMT3A, and purple represents DNMT3B). Correlation analysis of GLI1 (D), GLI2 (E), and GLI3 (F) expression with MMRs genes in human pan-cancer (*P < 0.05, **P < 0.01, ***P < 0.001).