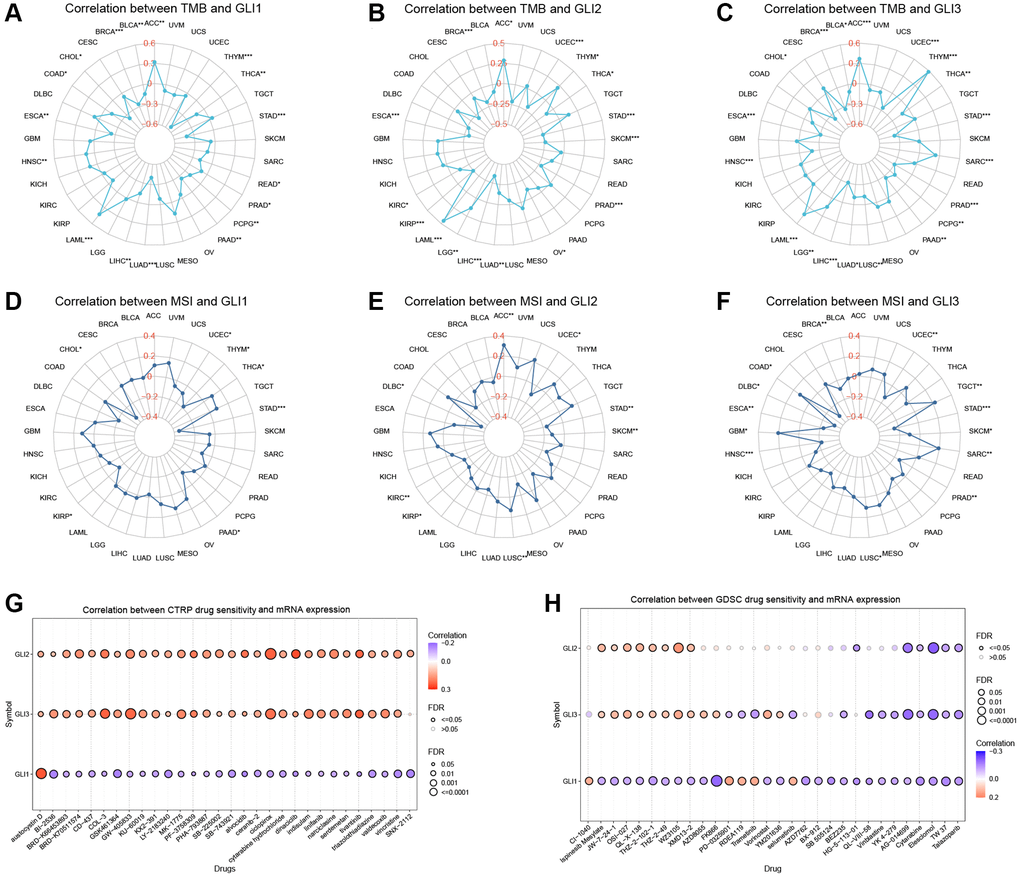
Figure 13.Relationship of GLI1, GLI2, and GLI3 with TMB, MSI, and drug sensitivity. The Relationship of GLI1, GLI2, and GLI3 expression with TMB (A–C) and MSI (D–F). Drug sensitivity analysis in CTRP database (G) and GDSC database (H).
Figure 13 — The comprehensive landscape of prognosis, immunity, and function of the GLI family by pan-cancer and single-cell analysis | Aging