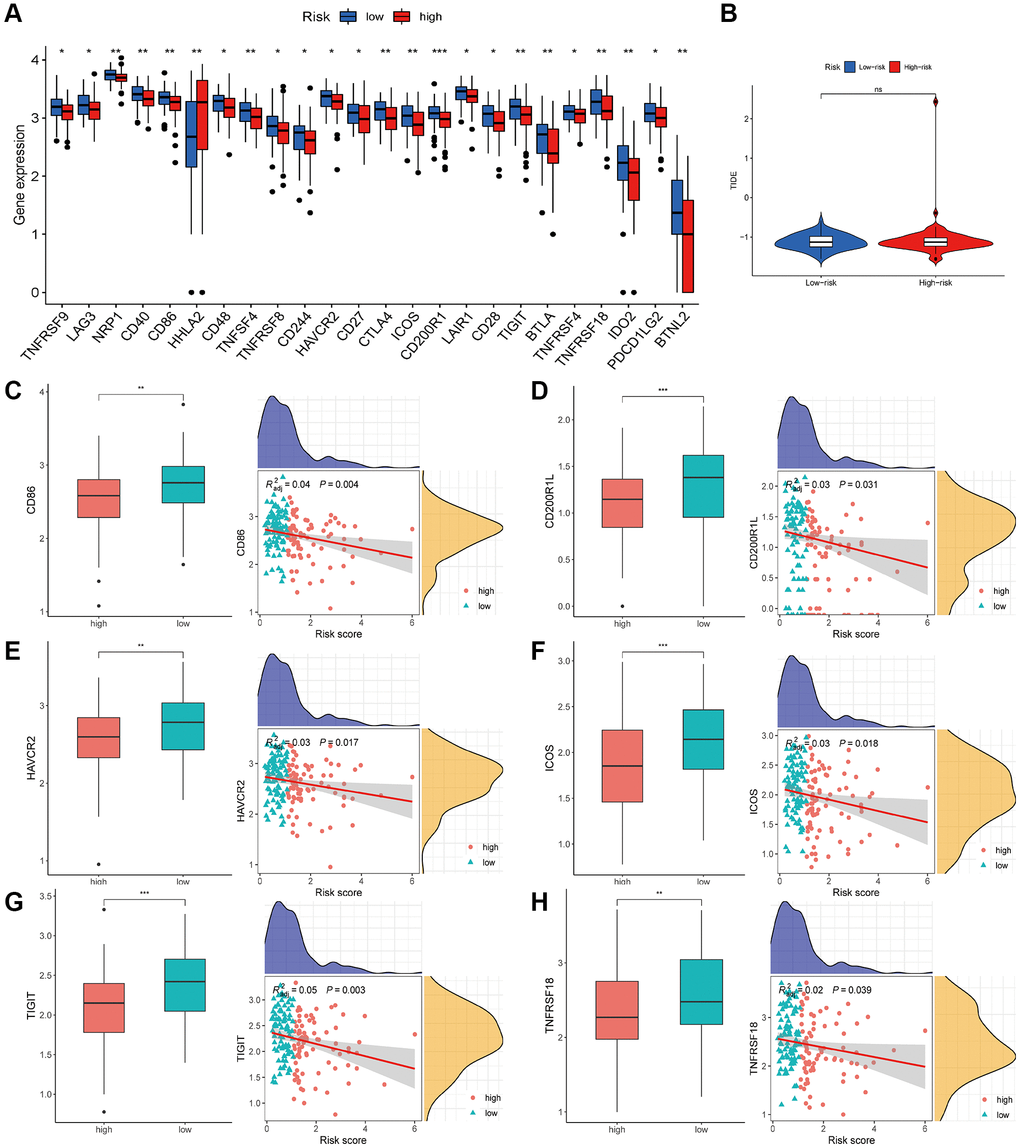
Figure 10.Estimation of the HARlncRNA signature in immunotherapy response. (A) Expression of ICGs in different risk groups. (B) Differences of TIDE score between the high- and low-risk groups. (C–H) Correlation of risk score with immune checkpoints. *P < 0.05; **P < 0.01; ***P < 0.001.