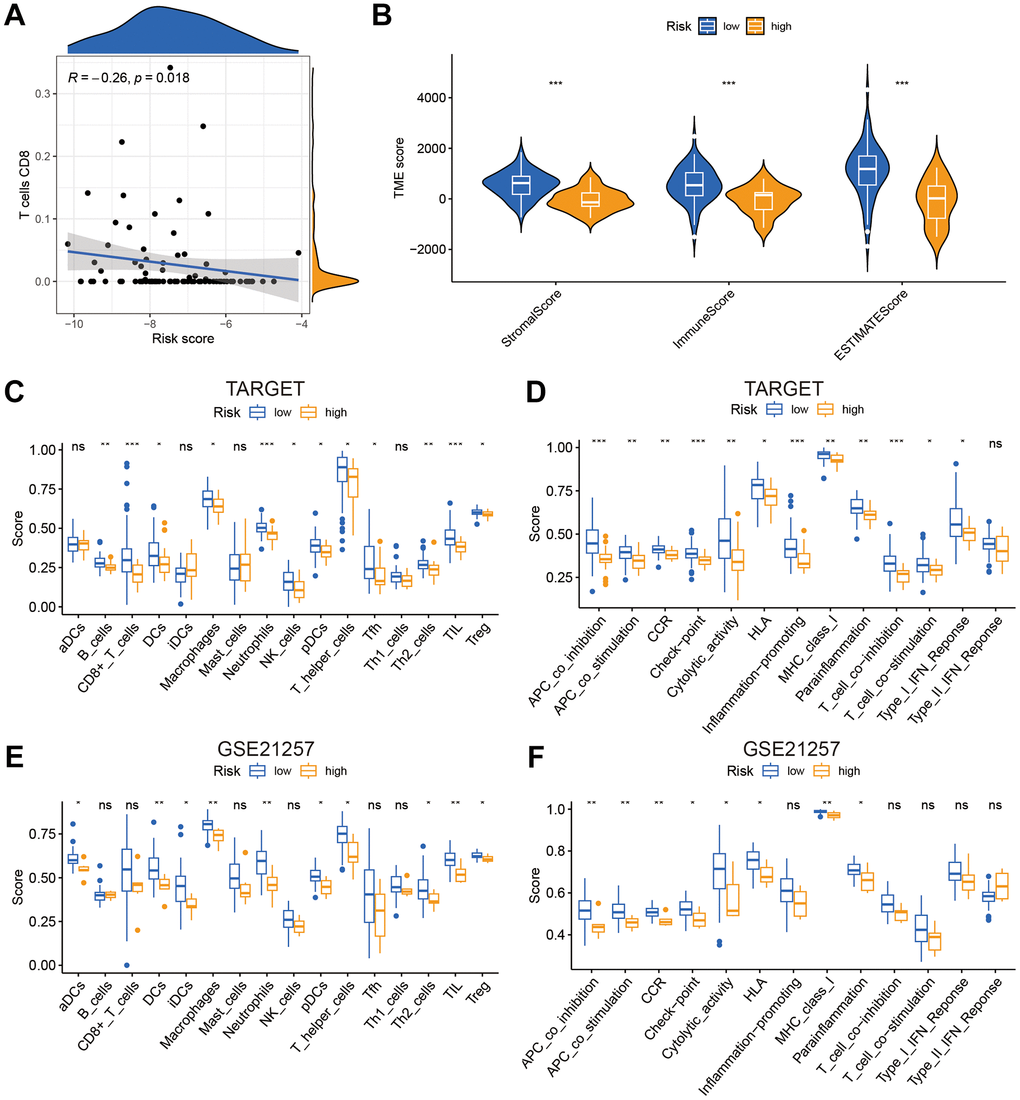
Figure 6.The risk score was related to immune infiltration. (A) The association between risk score and immune cell infiltration. (B) Risk score was significantly correlated with stromal scores, immune scores, and ESTIMATE scores. (C–F) Relationship between risk score and immune cell infiltration and related functions via ssGSEA analysis. *P<0.05, **P<0.01 and ***P<0.001.