Submit an Article
Navigate
Home
Editorial Board
Editorial Policies
Current Volume
Archive
Scientific Integrity
Publication Ethics Statements
Interviews with Outstanding Authors
Newsroom
Sponsored Conferences
Podcast
Contact
Special Collections
Submit an Article
Online ISSN: 1945-4589
Research Paper
|
Volume 16, Issue 6
|
pp. 5288–5310
Comprehensive assessment of regulatory T-cells-related scoring system for predicting the prognosis, immune microenvironment and therapeutic response in hepatocellular carcinoma
Back to article
Figure 10
(10 of 12)
−
100%
+
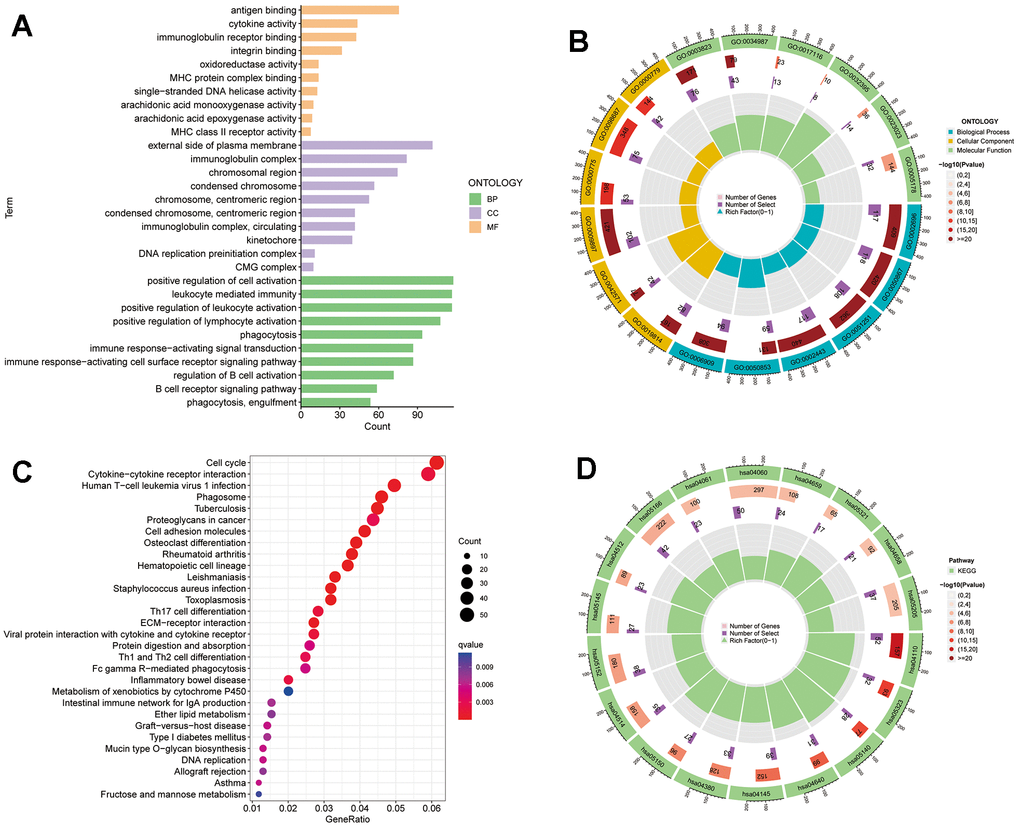
Figure 10.
TRSSys-based GO and KEGG analysis.
(
A
,
B
) GO analysis of the DEGs between the risk subgroups. (
C
,
D
) KEGG analysis of the DEGs between the risk subgroups.