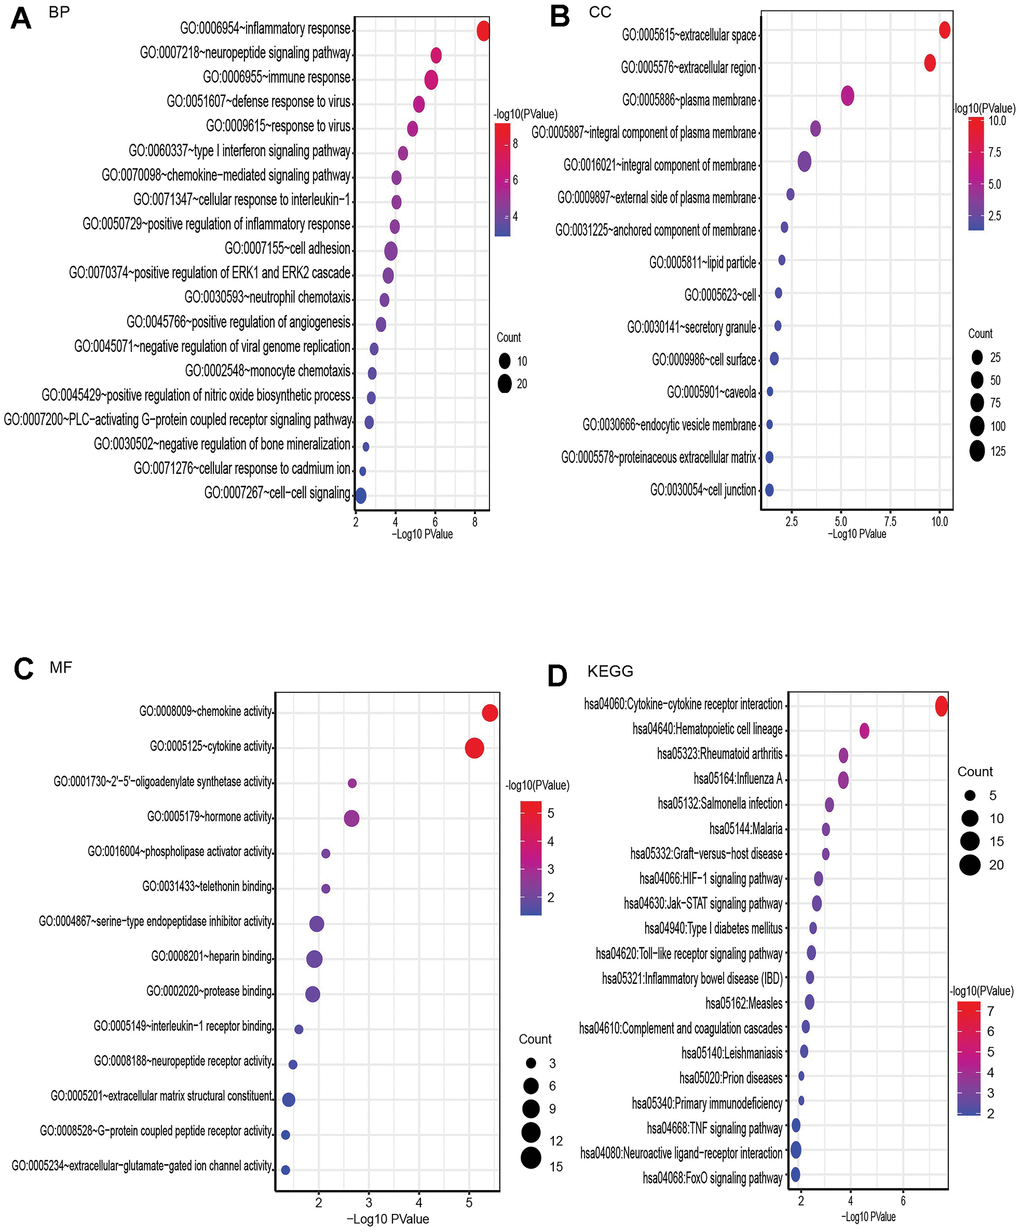
Figure 3.GO enrichment and KEGG pathway analysis of differentially expressed mRNAs, BP for biological process, MF for molecular function, and CC for cellular component. (A) Bubble plot of BP. (B) Bubble plot of CC. (C) Bubble plot of MF. (D) Bubble plot of KEGG.