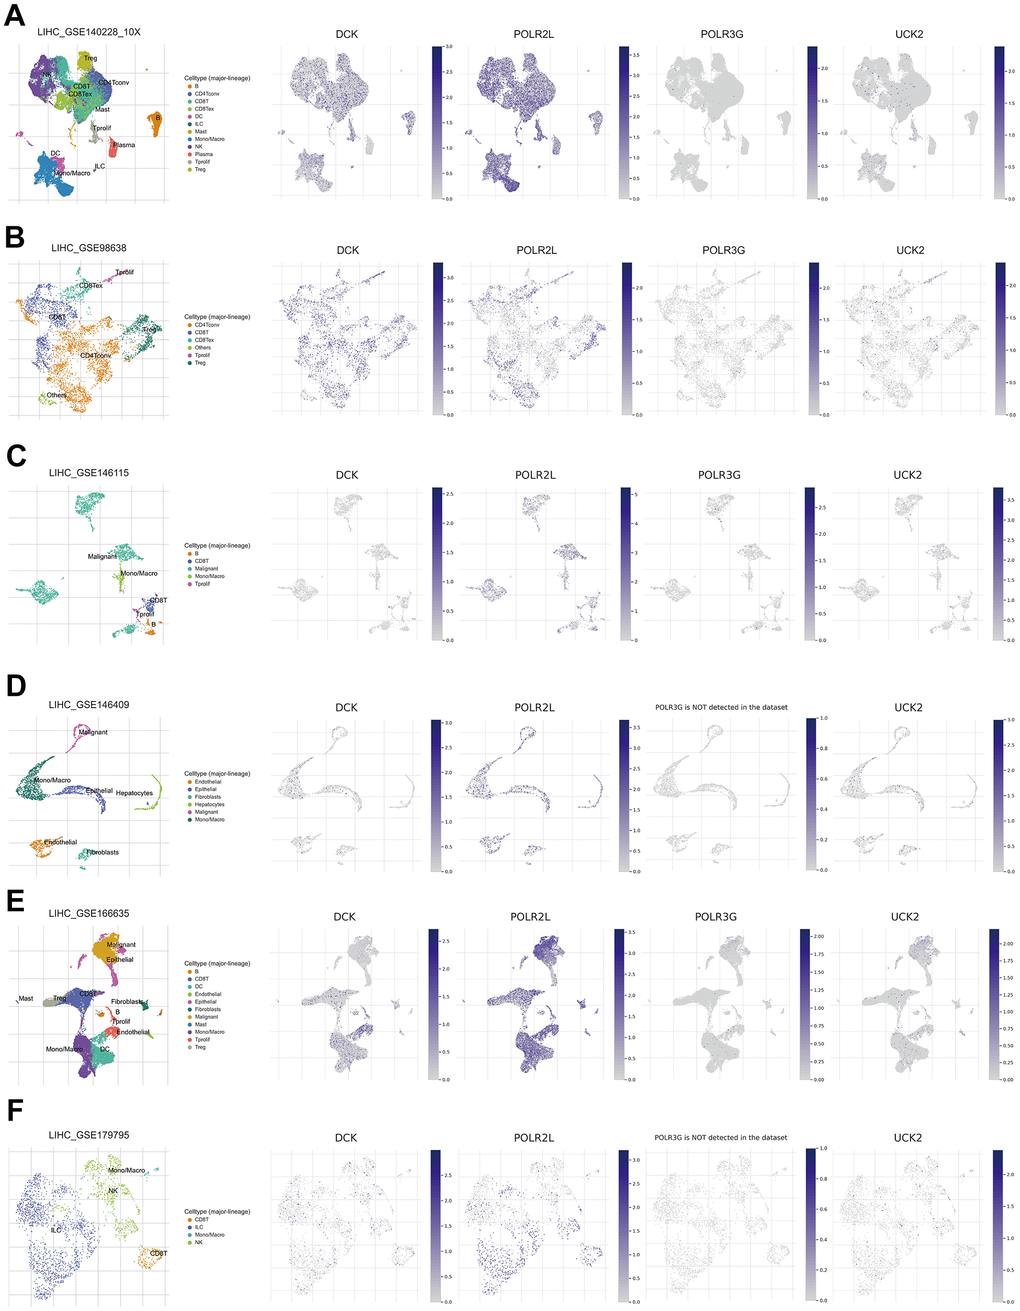
Figure 11.(A–F) Single-cell analysis of four model genes (DCK, POLR2L, POLR3G, UCK2) via TISCH based on GSE140228, GSE98638, GSE146115, GSE146409, GSE166635, GSE179795 datasets.
Figure 11 — A pyrimidine metabolism-related signature for prognostic and immunotherapeutic response prediction in hepatocellular carcinoma by integrating analyses | Aging