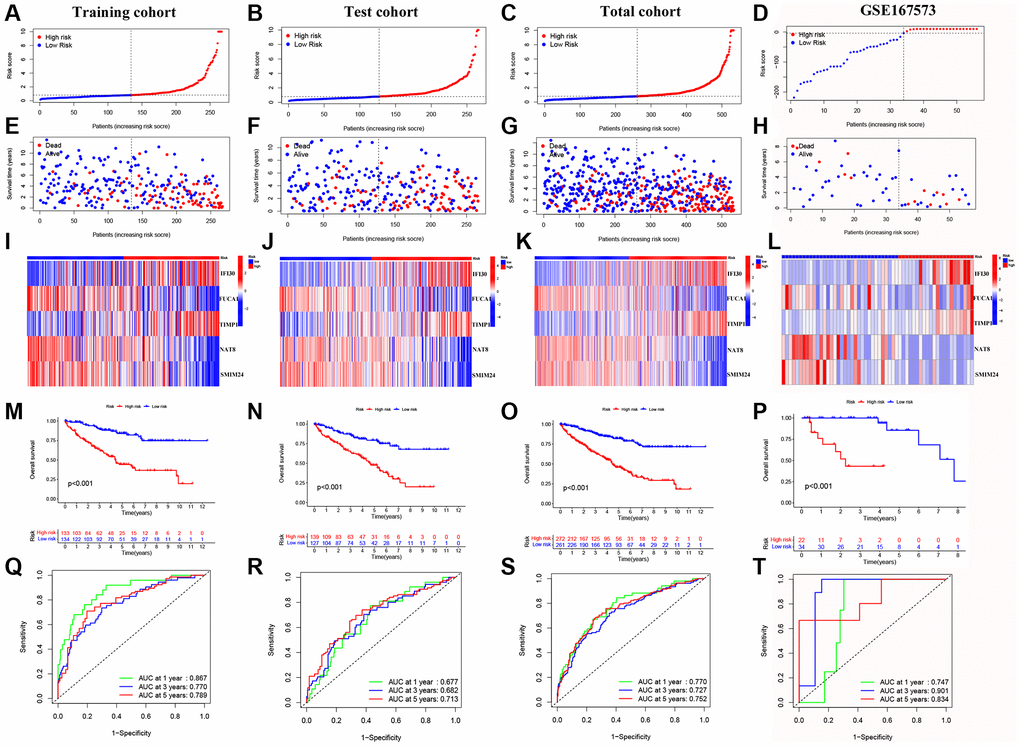
Figure 3.Validation of the prognostic model. (A–D) Distribution of risk scores for MMGs in TCGA-training, TCGA-test, TCGA-total and GEO cohorts, respective. (E–H) Scatter plot of the OS for each patient in the TCGA-training, TCGA-test, TCGA-total, and GEO cohorts, respectively. (I–L) Heatmaps of the risk cohort and the five MMGs in TCGA-training, TCGA-test, TCGA-total, and GEO cohorts, respectively. (M–P) The Kaplan-Meier curves in TCGA-training, TCGA-test, TCGA-total, and GEO cohorts, respectively. (Q–T) The AUC at 1-, 3-, and 5-year for the prognostic models in TCGA-training, TCGA-test, TCGA-total, and GEO cohorts, respectively.