Submit an Article
Navigate
Home
Editorial Board
Editorial Policies
Current Volume
Archive
Scientific Integrity
Publication Ethics Statements
Interviews with Outstanding Authors
Newsroom
Sponsored Conferences
Podcast
Contact
Special Collections
Submit an Article
Online ISSN: 1945-4589
Research Paper
|
Volume 16, Issue 7
|
pp. 5929–5948
RNA splicing regulator EIF3D regulates the tumor microenvironment through immunogene-related alternative splicing in head and neck squamous cell carcinoma
Back to article
Figure 3
(3 of 6)
−
100%
+
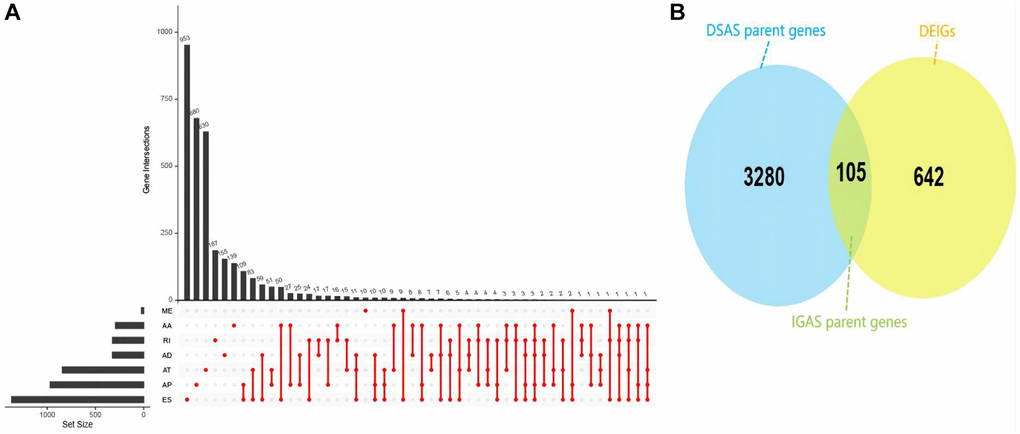
Figure 3.
Overview of IGAS events and parent genes in HNSC.
(
A
) UpSet plot illustrating interactions among the seven AS types of DSAS parent genes detected. (
B
) Venn plot displaying the intersection between DSAS parent genes and DEIGs.