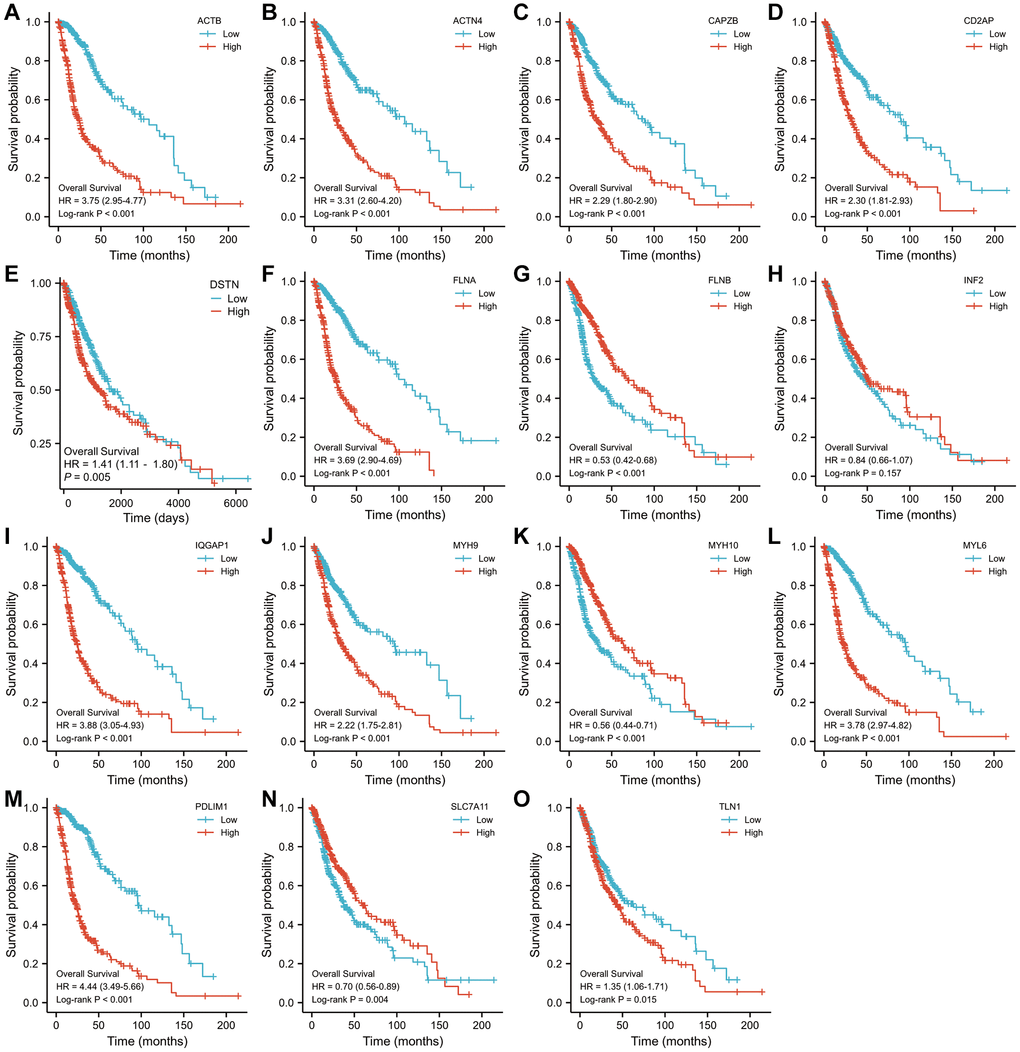
Figure 2.The Kaplan–Meier OS curves for patients in the high- and low-risk groups in the TCGA cohort (log-rank test). (A) ACTB, (B) ACTN4, (C) CD2AP, (D) CAPZB, (E) DSTN, (F) FLNA, (G) FLNB, (H) INF2, (I) IQGAP1, (J) MYH9, (K) MYH10, (L) MYL6, (M) PDLIM1, (N) SLC7A11, (O) TLN1.