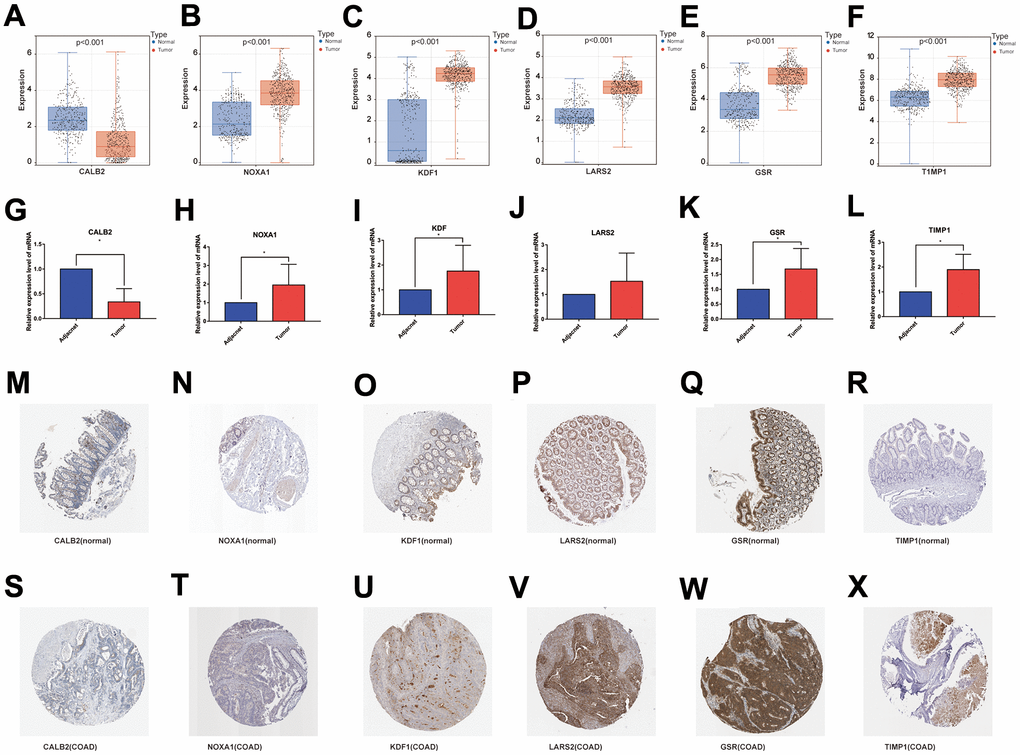
Figure 11.(A–F) mRNA expression levels of the 6 genes modeled in the databases (TCGA and GTEx); (G–L) RT-qPCR results of the 6 genes modeled in the collected clinical samples; (M–R) and (S–X) immunohistochemical results of the 6 genes modeled in normal colon tissue and COAD tissue.