Submit an Article
Navigate
Home
Editorial Board
Editorial Policies
Current Volume
Archive
Scientific Integrity
Publication Ethics Statements
Interviews with Outstanding Authors
Newsroom
Sponsored Conferences
Podcast
Contact
Special Collections
Submit an Article
Online ISSN: 1945-4589
Research Paper
|
Volume 16, Issue 9
|
pp. 7596–7621
Investigating gene signatures associated with immunity in colon adenocarcinoma to predict the immunotherapy effectiveness using NFM and WGCNA algorithms
Back to article
Figure 3
(3 of 11)
−
100%
+
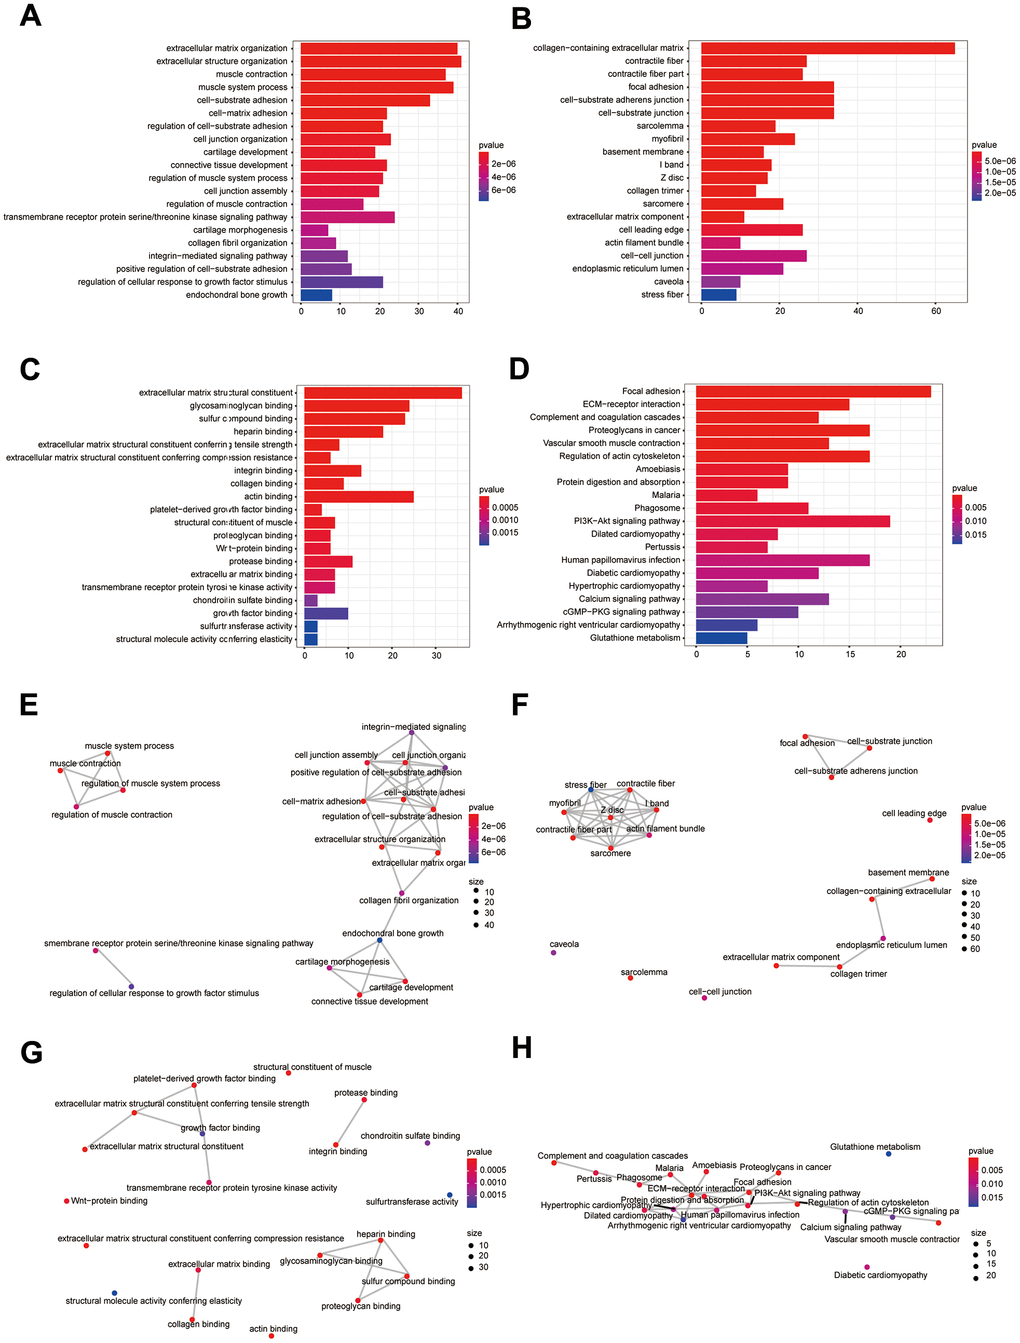
Figure 3.
Bioinformatics analysis of DEIGRC.
(
A
–
D
) Bar charts of BP, CC, MF, and KEGG enrichment analysis results; (
E
–
H
) Correlation analysis of the results from BP, CC, MF, and KEGG enrichment analysis.