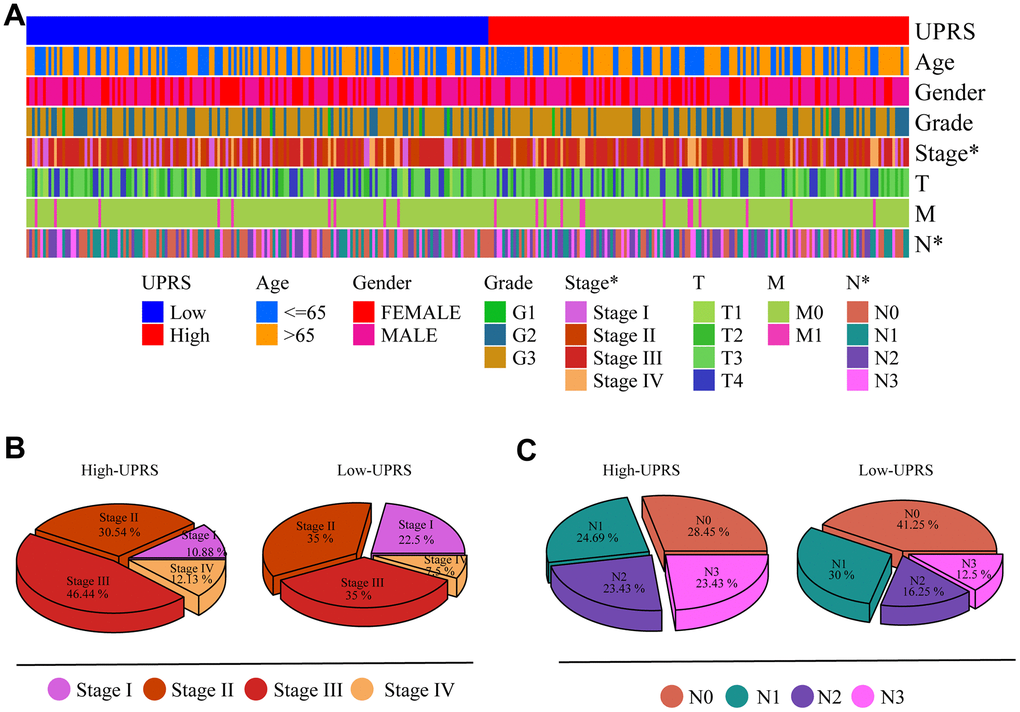
Figure 10.Differences in clinical variables were analyzed in patients with high- and low-UPRS. (A) Heat maps showed differences in clinical variables between patients with high- and low-UPRS. (B) The proportion of patients with high- and low-UPRS in each stage. (C) The proportion of patients with high- and low-UPRS in each N stage.