Submit an Article
Navigate
Home
Editorial Board
Editorial Policies
Current Volume
Archive
Scientific Integrity
Publication Ethics Statements
Interviews with Outstanding Authors
Newsroom
Sponsored Conferences
Podcast
Contact
Special Collections
Submit an Article
Online ISSN: 1945-4589
Research Paper
|
Volume 16, Issue 9
|
pp. 7889–7901
Predictive value of FCGBP expression for treatment response and survival in rectal cancer patients undergoing chemoradiotherapy
Back to article
Figure 4
(4 of 4)
−
100%
+
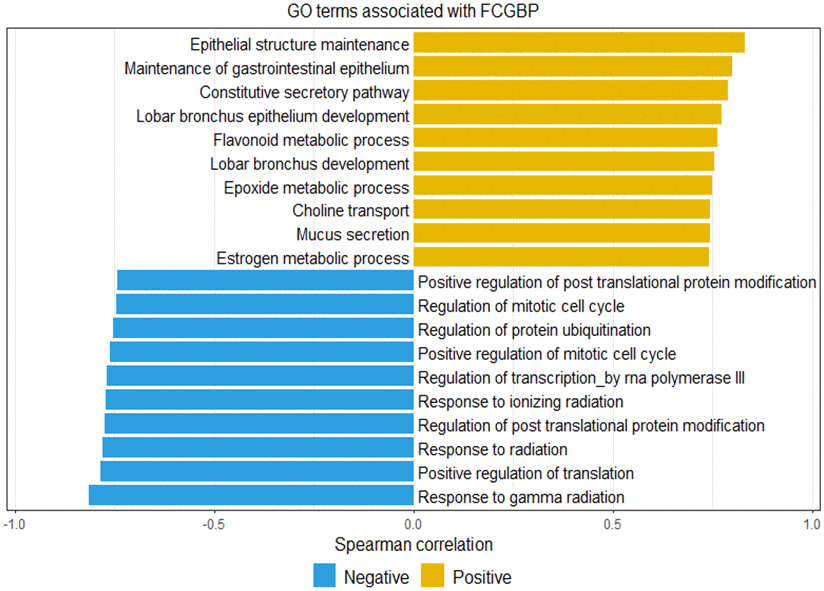
Figure 4.
Gene ontology terms representation based on the top 10 positive and negative correlations with
FCGBP
expression.
Yellow indicates positive correlations, and blue indicates negative correlations.