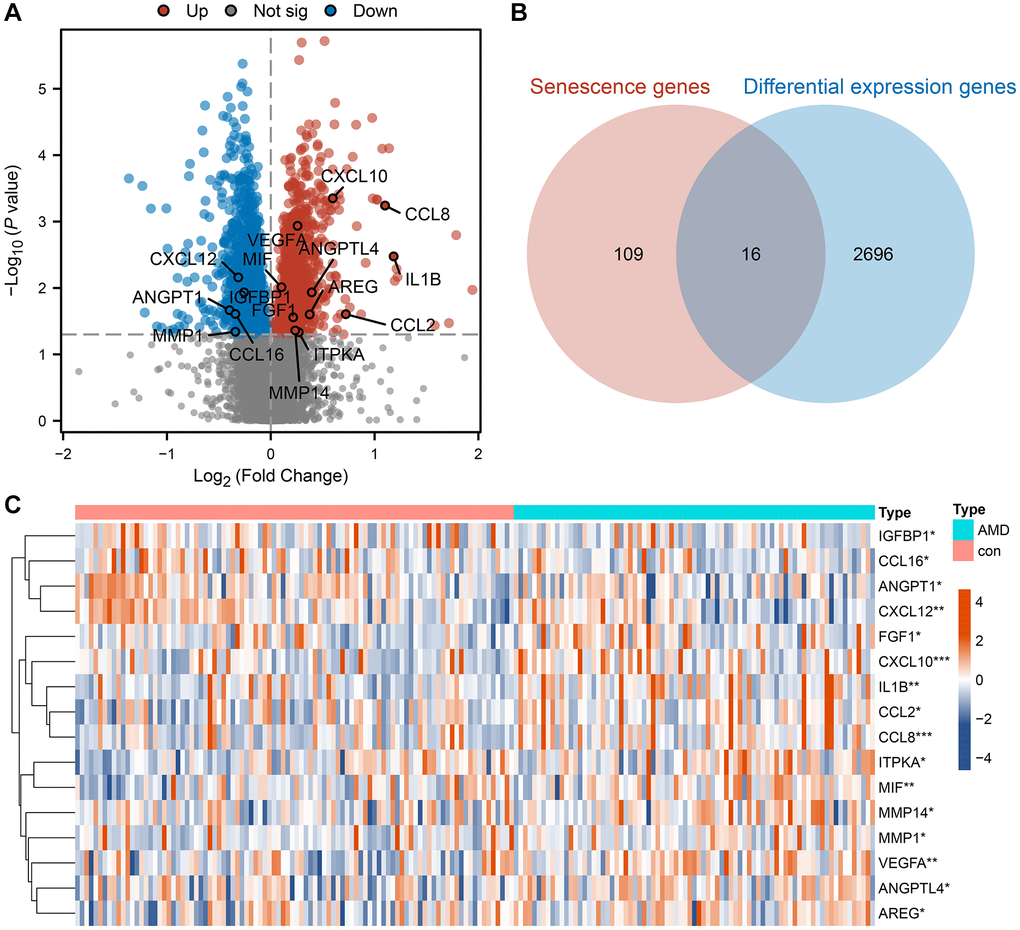
Figure 2.Identification of differential expression cellular senescence genes in AMD. (A) Differential expression volcano plot between the AMD and control groups. The red dot indicates up-regulated genes in the AMD group, the blue dot indicates down-regulated genes and the grey dot indicates the difference is not significant. (B) The intersection of senescence genes and differential expression genes between AMD and the control group. (C) Expression heatmap of SRDEGs in AMD and control sample. Red represents upregulation and blue represents downregulation. (*P < 0.05; **P < 0.01; ***P < 0.001).