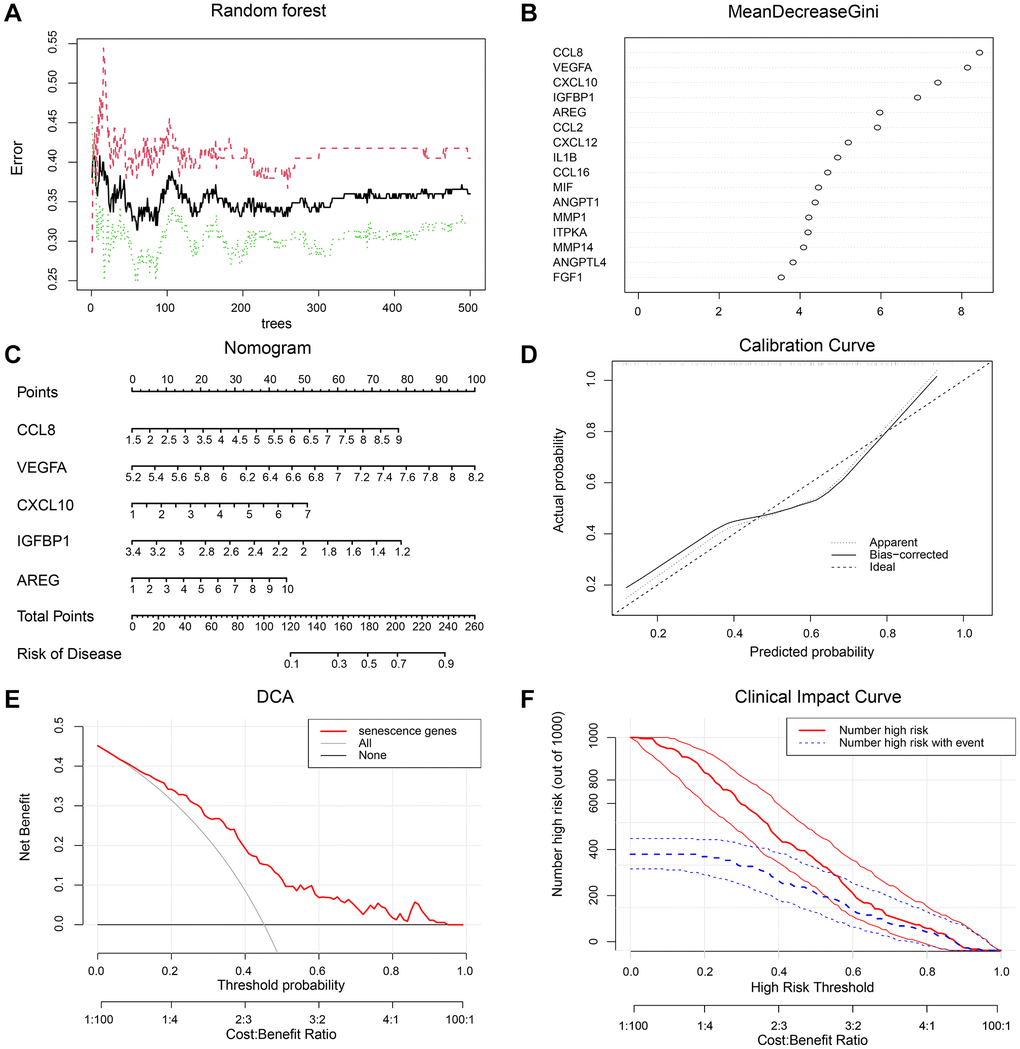
Figure 3.A diagnostic model was constructed with SRDEGs. (A) Random forest out-of-bag error curve. (B) Gini importance scores of candidate genes. (C) Nomogram of key genes to predict the risk for AMD. The expression of five risk genes, CCL8, VEGFA, CXCL10, IGFBP1, and AREG, was used as the axis. A straight line was drawn on the ‘Points’ axis to determine the scores related to these genes. The resulting scores were summed and the total score was placed on the ‘Total Points’ axis. A straight line was drawn down the ‘Risk of Disease’ axis to obtain the risk of developing AMD. (D) Calibration curve of the diagnostic model. (E) Decision curve analysis of the diagnostic model. (F) Clinical impact curve of the diagnostic model.