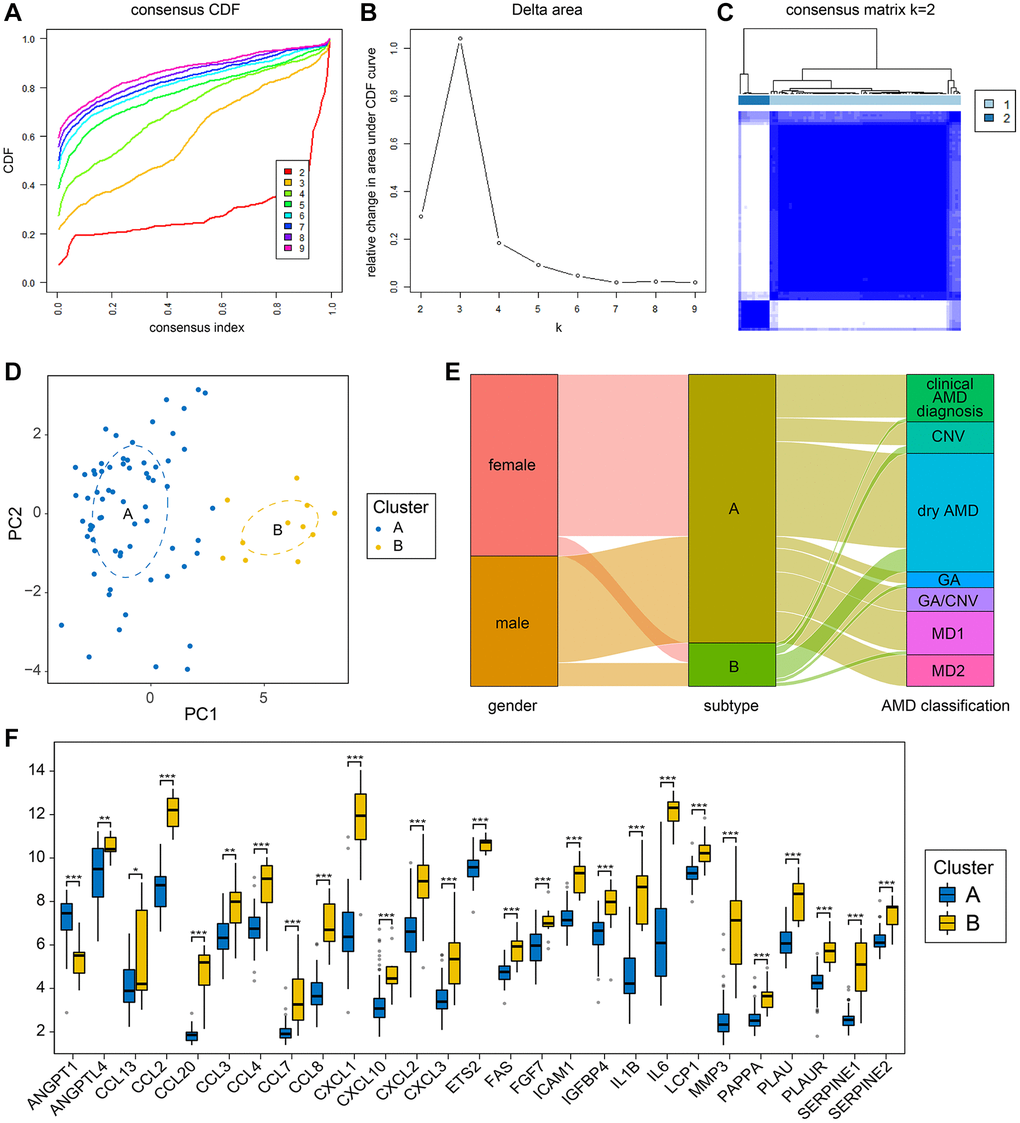
Figure 4.Cellular senescence-related subtypes established by unsupervised clustering. (A) The CDF curves illustrate the cumulative distribution functions for varying values of K, with the clustering effectiveness being most reliable when K = 2. (B) Delta area plots for different values of K during the clustering process. (C) Clustering heatmap for unsupervised clustering when k = 2. (D) PCA illustrates the classification outcomes of the two subtypes. (E) Sankey diagram comparing clinical grouping styles and subtype grouping styles of AMD samples. (F) Senescence-related differential expression genes grouping comparison between the two subtypes. (*P < 0.05; **P < 0.01; ***P < 0.001).