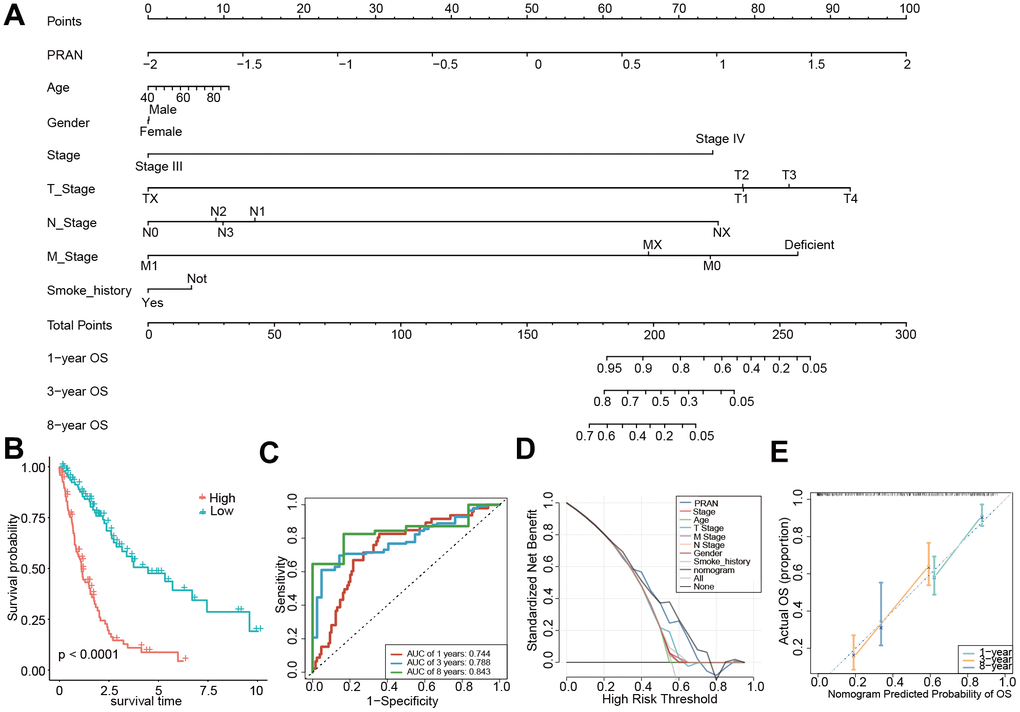
Figure 10.Construction and validation of the PRAN score-based nomogram. (A) The nomogram plot was constructed in the training cohort with incorporation of PRAN and clinical characteristics. (B) Kaplan-Meier survival curves based on PRAN scores calculated using the nomogram. (C) ROC curves for predicting 1-year, 3-year and 8-year OS for the nomogram. (D) Decision curve analysis of nomogram, PRAN risk model and clinical characteristics. The black line in this Figure indicates the assumption of no patient death. (E) Nomogram calibration plot based on the agreement between predicted and observed values at 1, 3, and 8 years. X-axis is nomogram predicted overall survival, y-axis is actual overall survival, dashed line is ideal performance of nomogram, and 95% confidence interval is represented by closed vertical line.