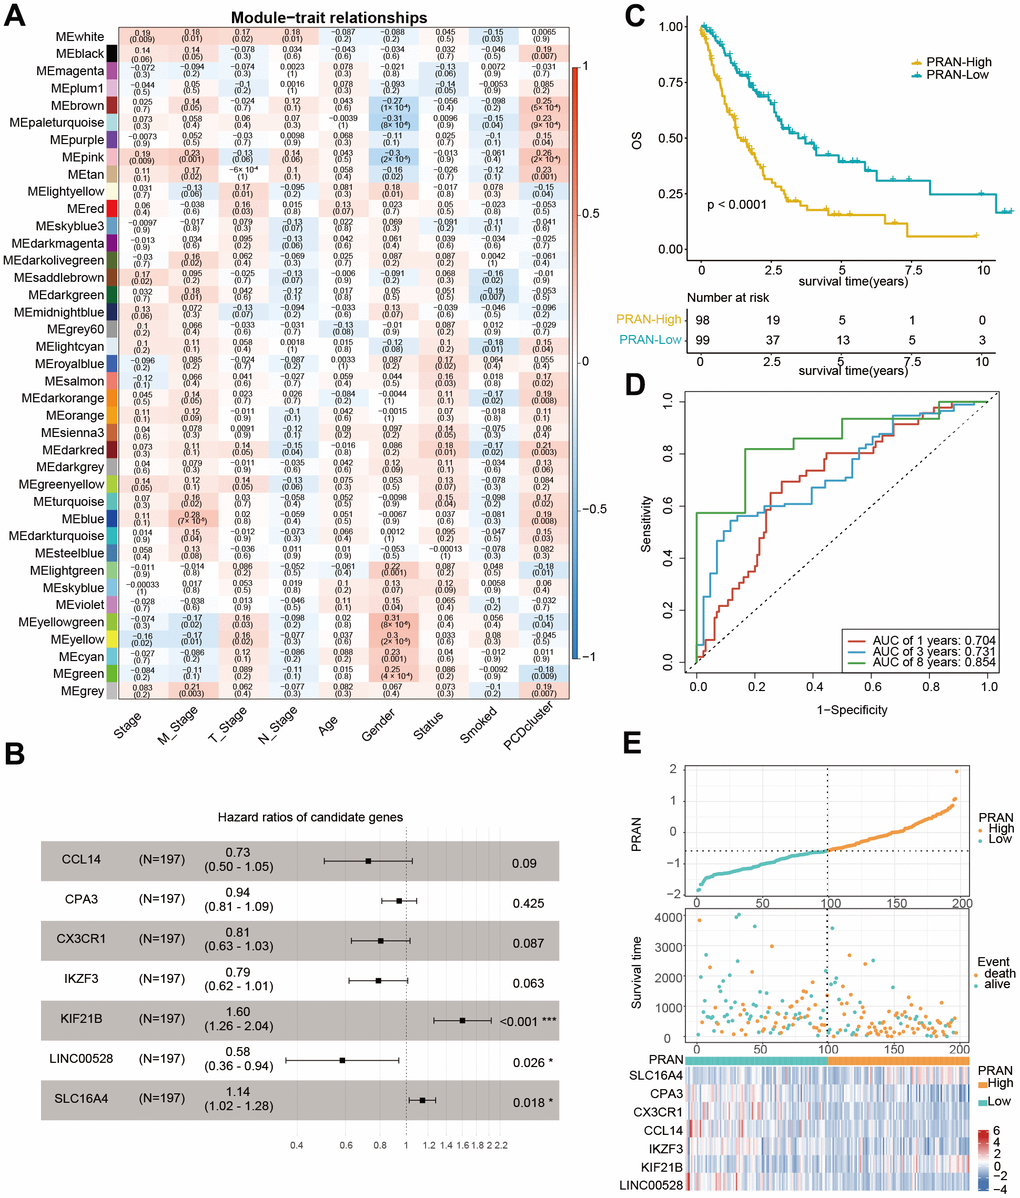
Figure 4.Development of prognostic signature using PCD-related genes in TCGA-Advanced NSCLC dataset. (A) Heatmap of correlation between gene modules and clinical traits, each cell containing Pearson’s correlation coefficient and p-value. (B) Forest plot depicting the associations between the expression levels of seven PCD genes and overall survival (OS) in the training cohort. Hazard Ratio (HR), 95% Confidence Interval (CI), and p-value were determined by multivariate Cox regression analysis. (C) Kaplan-Meier (KM) curve analysis of the prognostic model in the training set, showing the survival differences between high-risk and low-risk groups. (D) Time-dependent receiver operating characteristic (ROC) curves and area under the curve (AUC) values of the PRAN model for predicting survival status in 1-, 3-, and 8-year. (E) Comparison of PRAN scores, survival status, and expression of seven PCD genes between PRAN-High and PRAN-Low groups. P-value: * < 0.05; *** < 0.001.