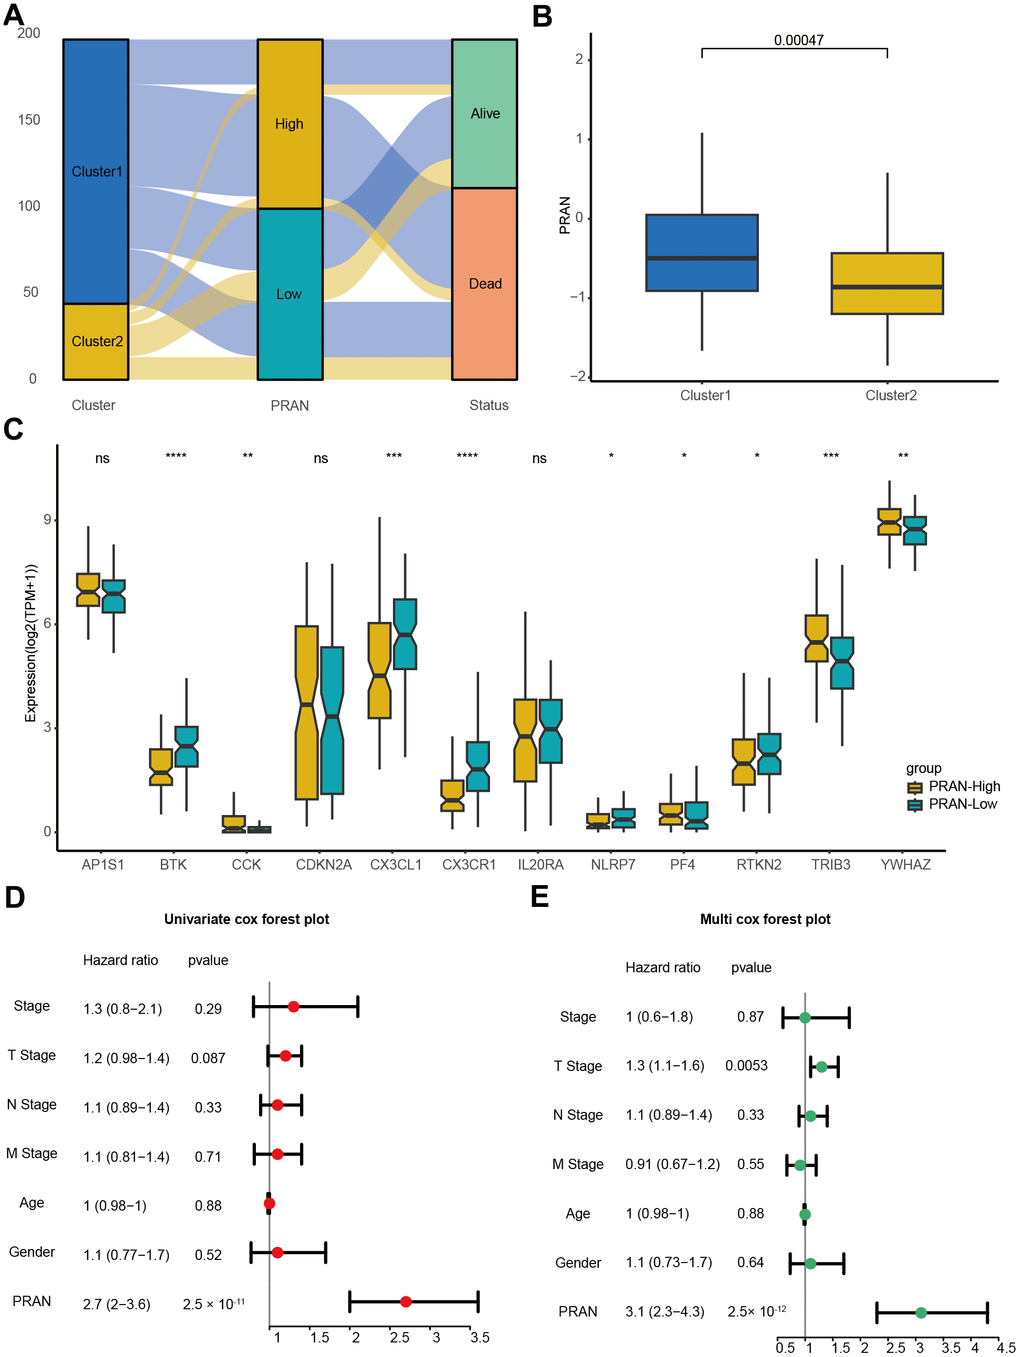
Figure 5.The correlation validation of PRAN risk model in TCGA-Advanced NSCLC dataset. (A) The Sankey plot illustrates the distribution of PCD risk groups, PCD clusters, and survival outcomes. (B) Box plots depicting the relationship between PCD clusters and PRAN risk groups. (C) Box plots showing the expression levels of 12 PCD-related prognosis genes between PRAN-High and PRAN-Low groups. (D) Univariate Cox regression analysis of PCD risk scores and clinical variables. (E) Multivariate Cox regression analysis of PCD risk scores and clinical variables. P-value: ns >=0.05; * < 0.05; ** < 0.01; *** < 0.001; **** < 0.0001.