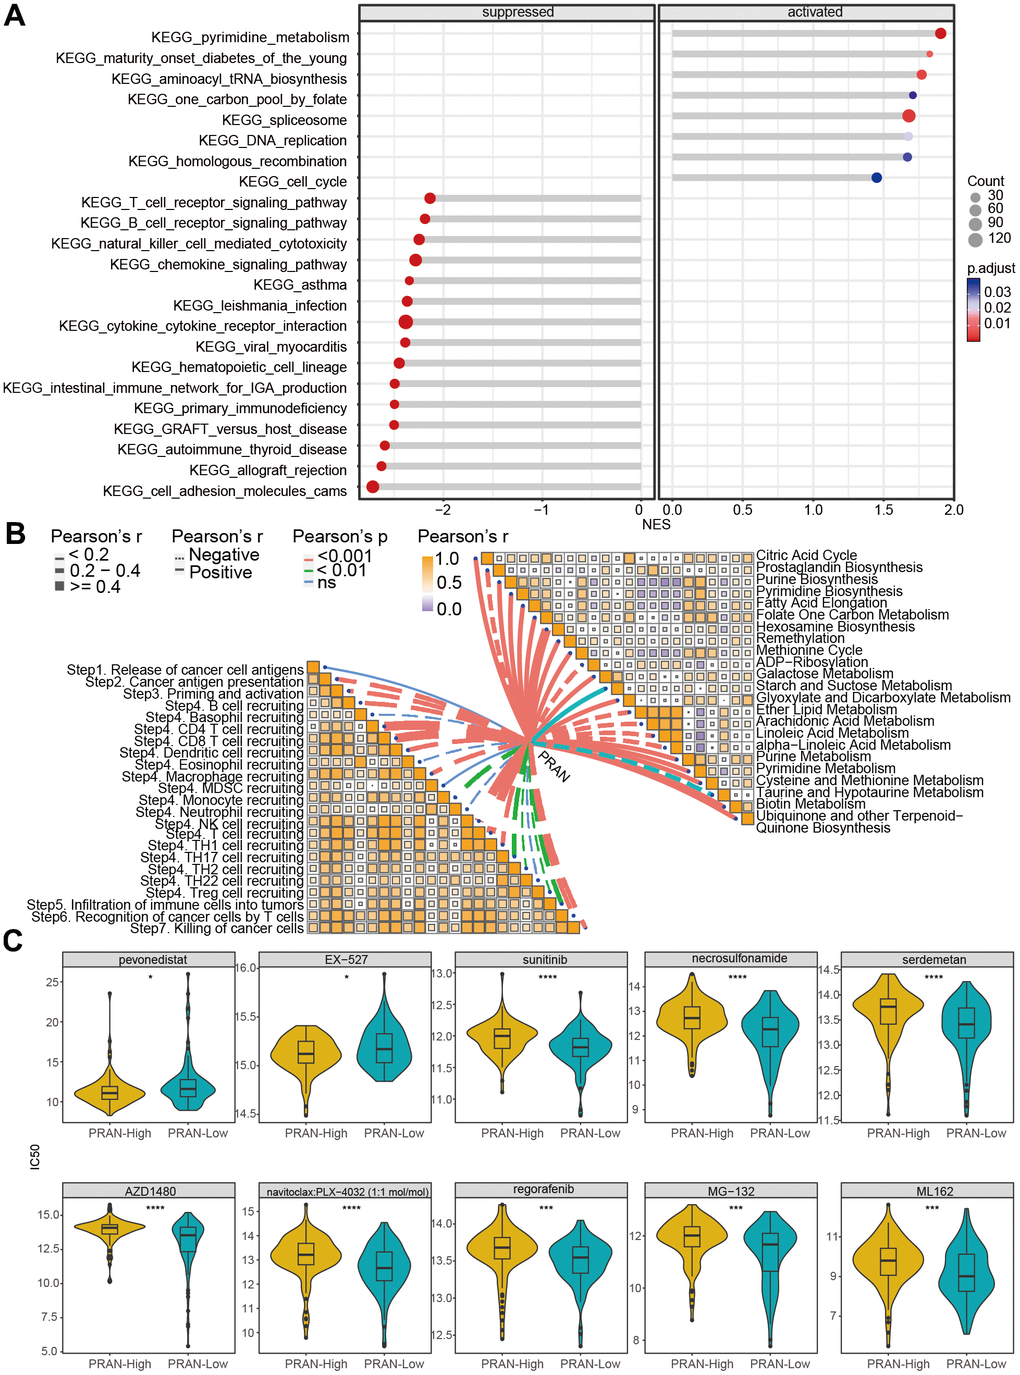
Figure 6.Biological function analysis and drug-susceptibility analysis of PRAN risk model in TCGA-Advanced NSCLC dataset. (A) The lollipop plot displays the top 10 significantly enriched suppressed pathways and all activated pathways in the PRAN-High and PRAN-Low groups. (B) Pearson correlation analysis demonstrates the relationship between PCD scores and cancer immune cycle activity (left) and metabolism-related pathways (right). (C) Sensitivity analysis of anti-tumor drugs between PRAN-High and PRAN-Low groups. P-value: ns >=0.05; * < 0.05; ** < 0.01; *** < 0.001; **** < 0.0001.