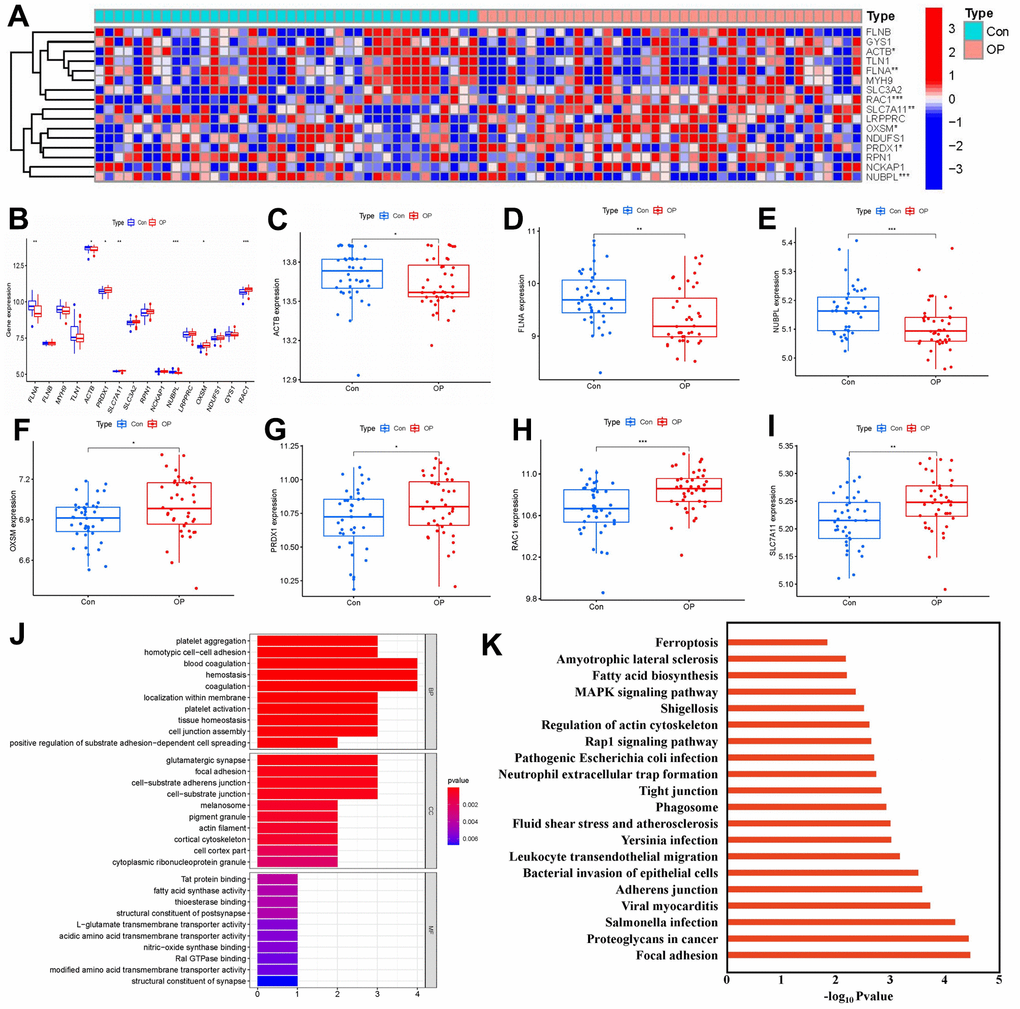
Figure 2.Identification of 16 disulfidptosis modulators in OP. (A) Expression heat map of 16 disulfidptosis modulators in OP cases and controls. (B) Differential expression box plot of 16 disulfidptosis modulators identified between OP cases and controls. (C–I) Differential expression box plots of seven significant disulfidptosis modulators identified between OP cases and controls. (J, K) GO and KEGG enrichment analysis based on seven significant disulfidptosis modulators. *P < 0.05, **P < 0.01, ***P < 0.001.