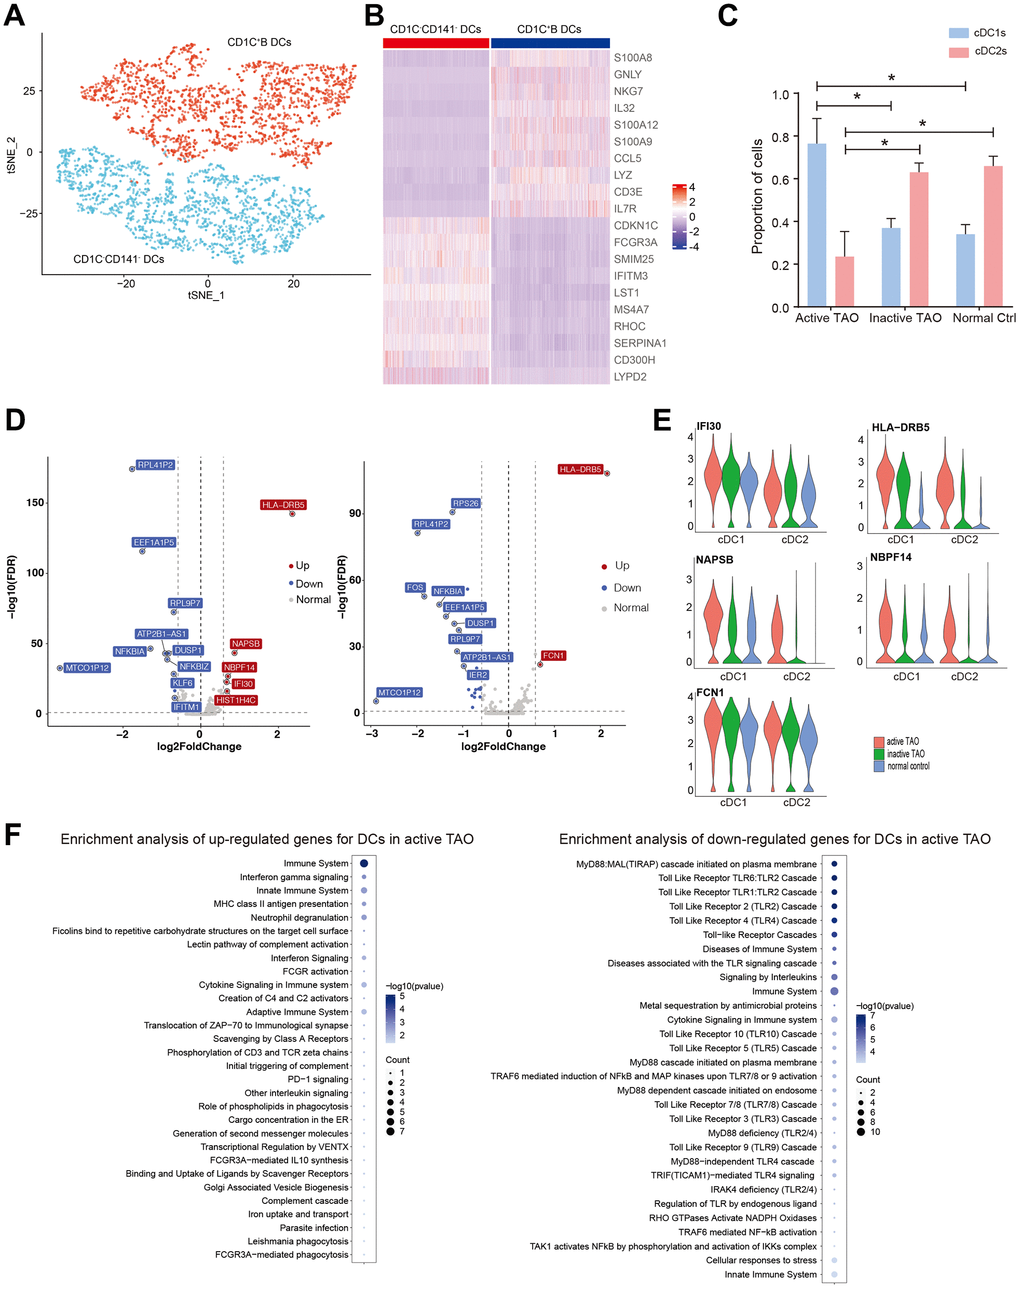
Figure 5.Activation of DCs may be associated with the inflammation during active TAO. (A) tSNE plot of subgroups of DCs. (B) Heatmap of DEGs between three different DC subgroups. (C) Bar chart showing the relative proportion of CD1C-CD141- DCs and CD1C+B DCs from active TAO, inactive TAO and NCs (* p<0.05). (D) Volcano plots showing DEGs of CD1C-CD141- DCs (left), and CD1C+B DCs (right) from active TAO patients and NCs. (E) Violin plots showing the expression of HLA-DRB5, IFI30, NAPSB, FCN1, MT-ATP6, FTL, SERPINA1, LTA4H, and NBPF14 in CD1C-CD141- DCs and CD1C+B DCs from active TAO patients and NCs. (F) Representative Reactome terms enriched by upregulated (left) and downregulated (right) DEGs of DCs in active TAO.