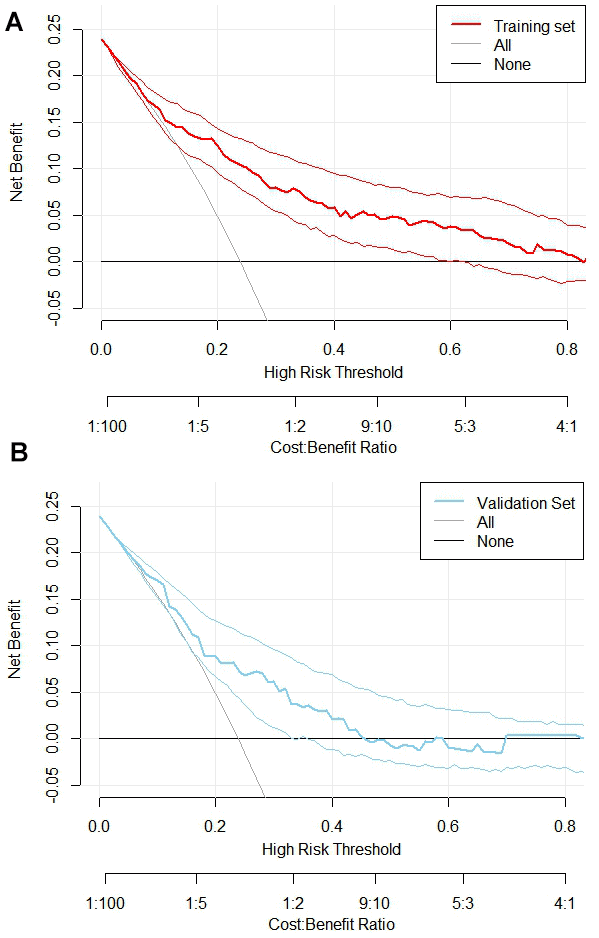
Figure 6.Clinical decision curve analysis for nomogram models. (A) Training Set DCA; (B) Validation Set DCA. The DCA was plotted with the probability of high-risk threshold as abscissa and the net benefit rate as ordinate, where the probability of high-risk threshold was set to (0, 1), the solid black line represents the net benefit rate without MVA in all patients, the solid gray line represents the net benefit rate with MVA in all patients, the red curve represents the decision curve of the nomogram model of the training set, and the blue sky represents the decision curve of the validation set