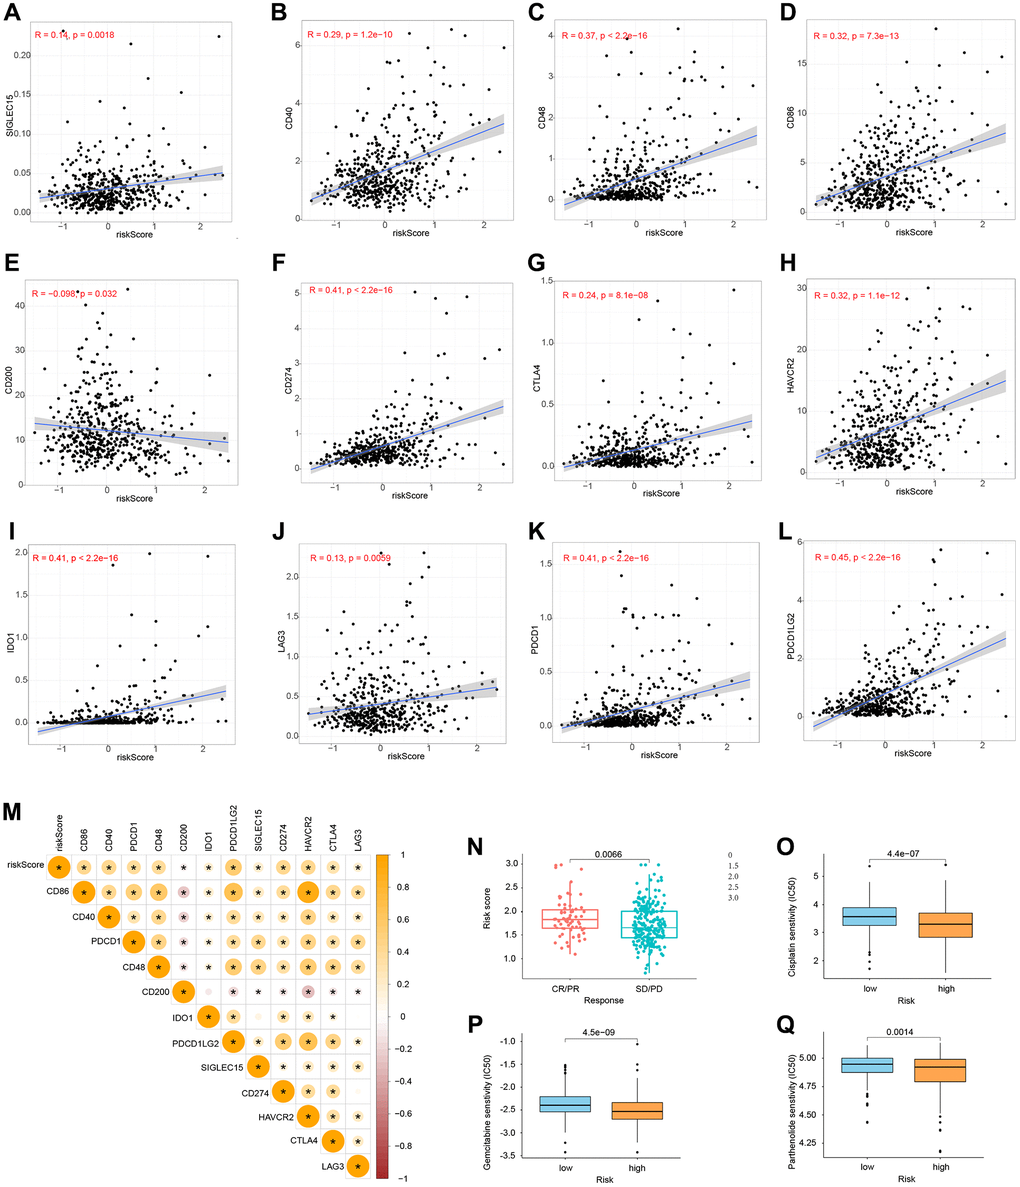
Figure 11.Immune checkpoints and chemotherapy sensitivity. (A–M) Relationship between risk model and immunological checkpoints. (N) Immunotherapy response and risk score. (O–Q) Chemotherapy sensitivity and risk score.
Figure 11 — A cuproptosis-based prognostic model for predicting survival in low-grade glioma | Aging