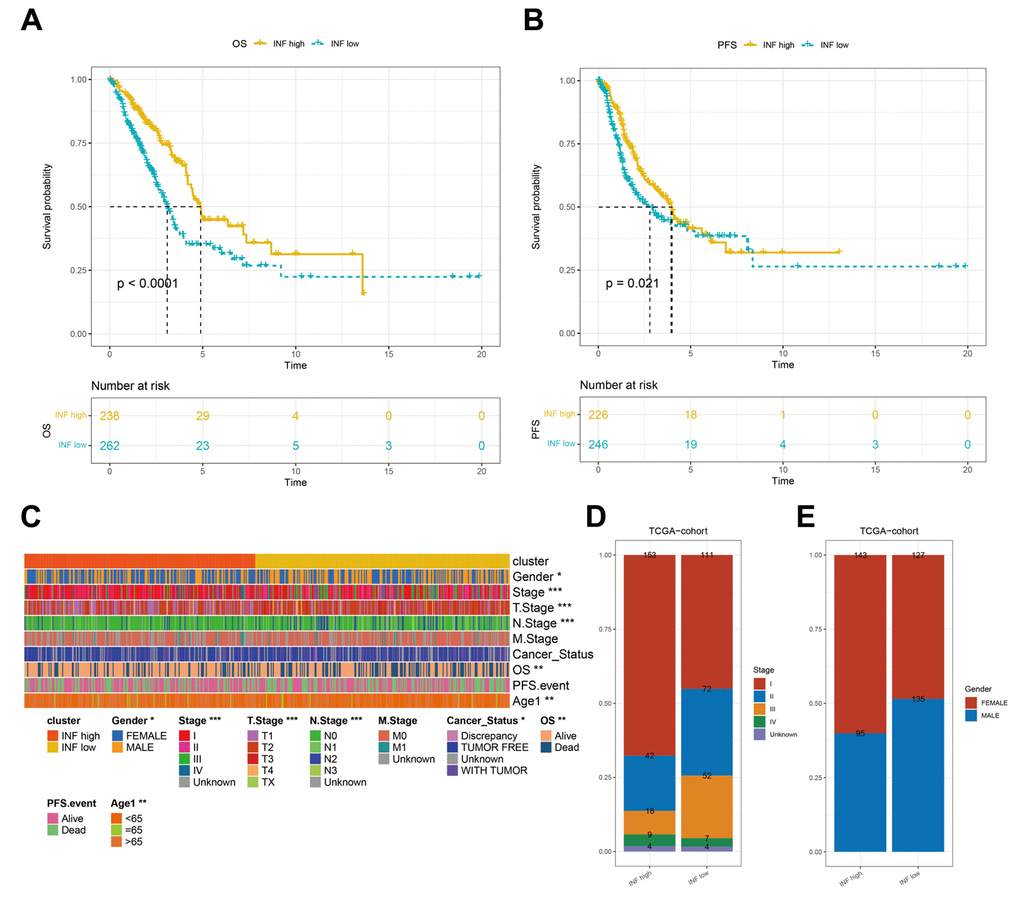
Figure 2.Differences in the prognostic and clinicopathologic features among the inflammation subtypes. (A, B) Kaplan–Meier OS and PFS curves of patients from TCGA cohort assigned as INF-low and -high subtypes. (C–E) The clinicopathologic features of the subtypes.