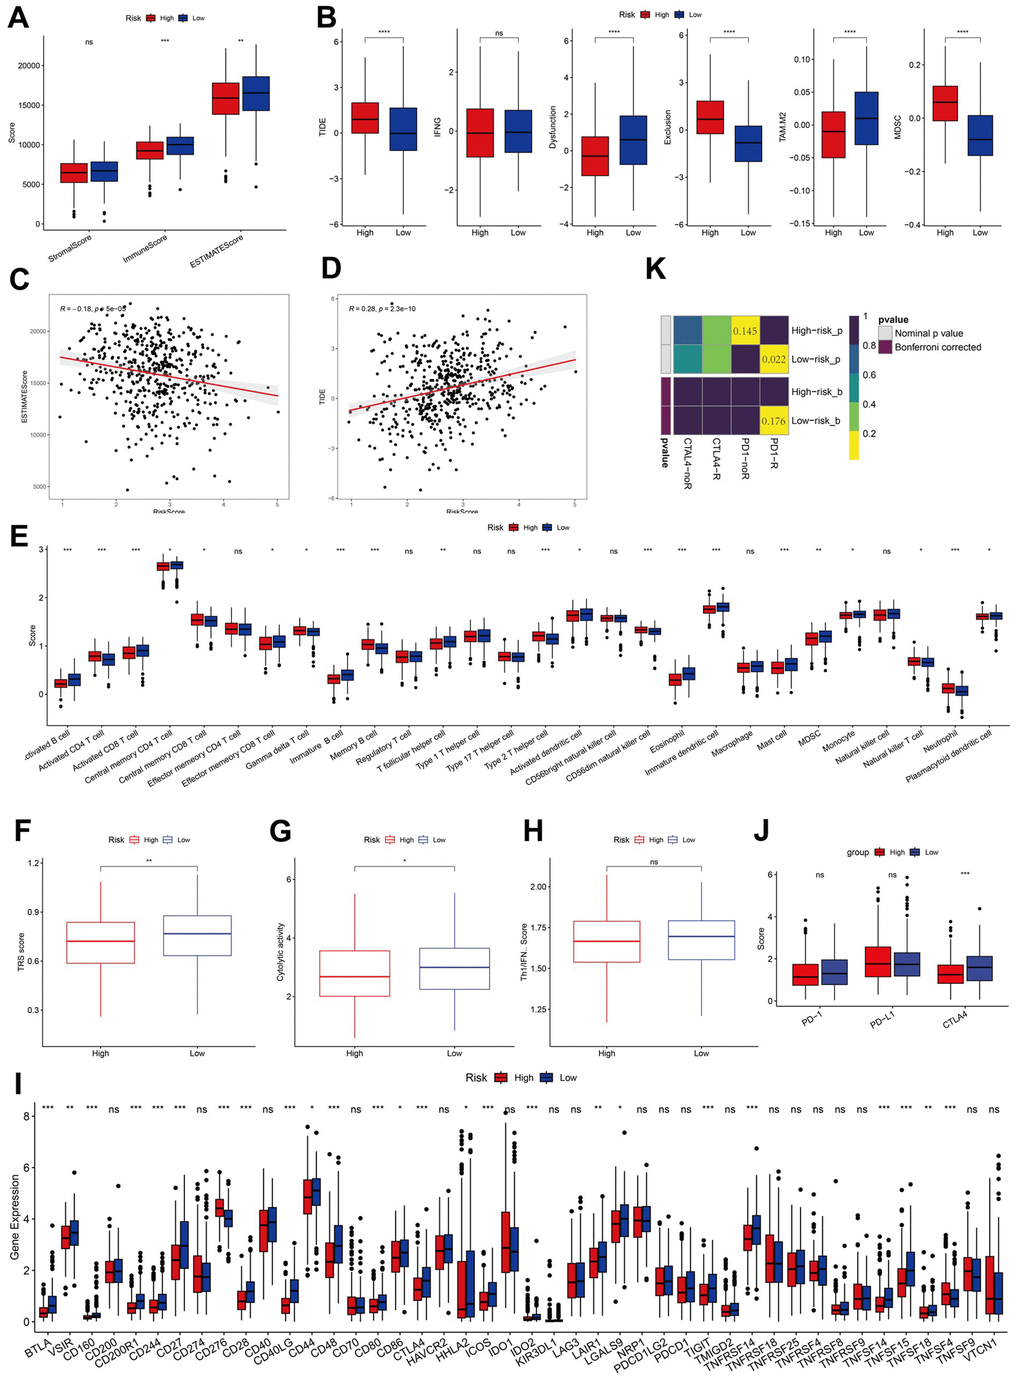
Figure 7.Analysis of immunity status of risk groups. (A–D) Immune status and immunotherapy between risk groups. (E–H) Active or suppressive TME between risk groups. (I, J) Exploration of immune checkpoints. (K) Submap analysis. *P <0.05, **P <0.01, ***P <0.001, ****P < 0.0001.