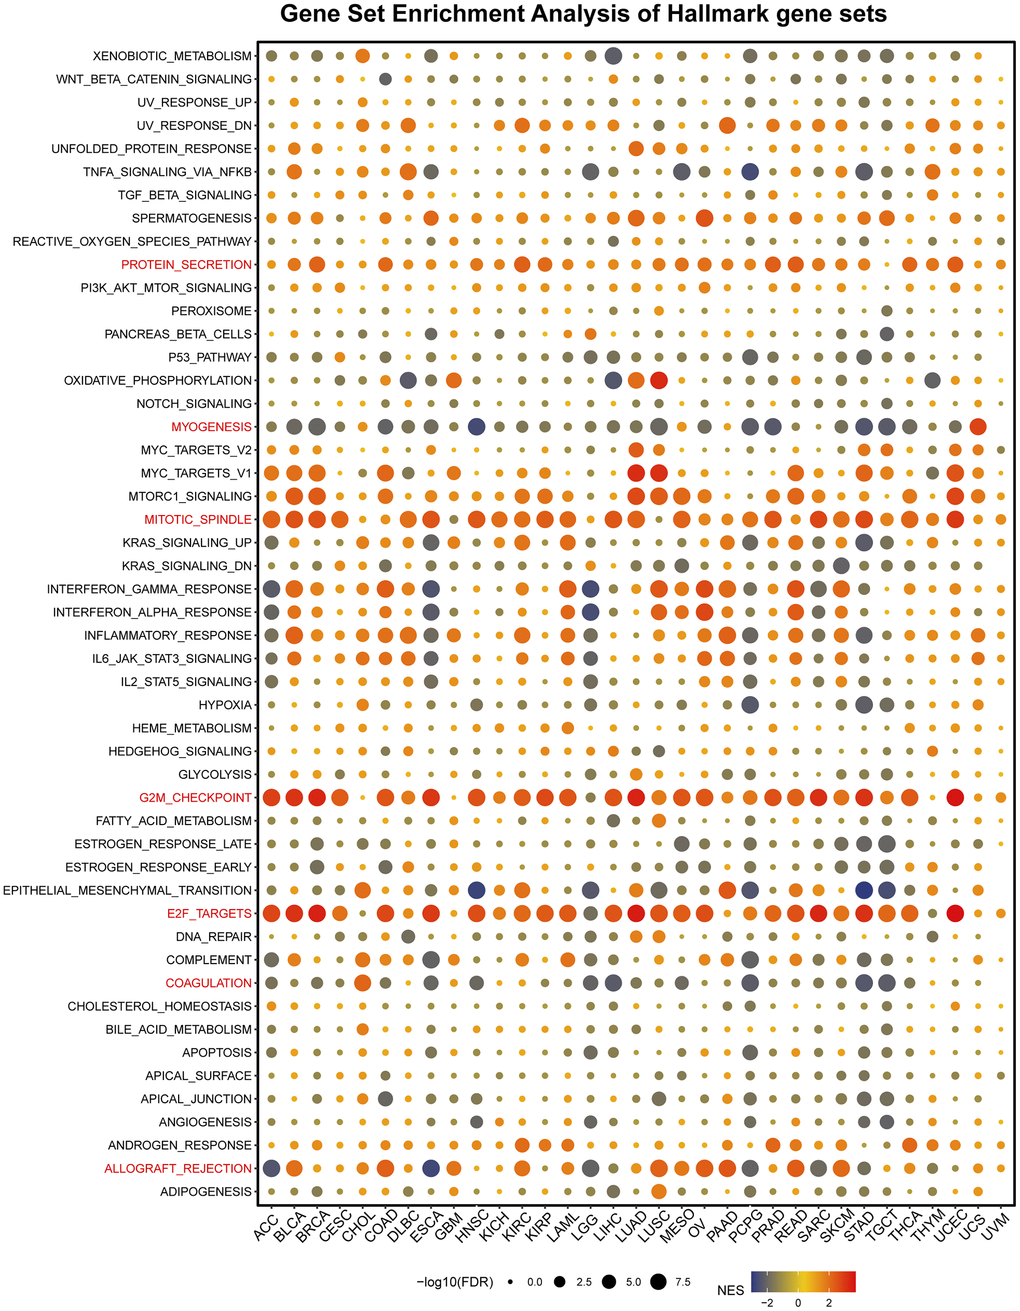
Figure 5.Gene set enrichment analysis of hallmark gene sets. The statement explains that in a certain analysis, circles were used to represent enriching terms in different types of cancer. The size of each circle indicated the false discovery rate (FDR) value of that term in that cancer. Additionally, the color of each circle represented the normalized enrichment score (NES) of that term in that cancer.