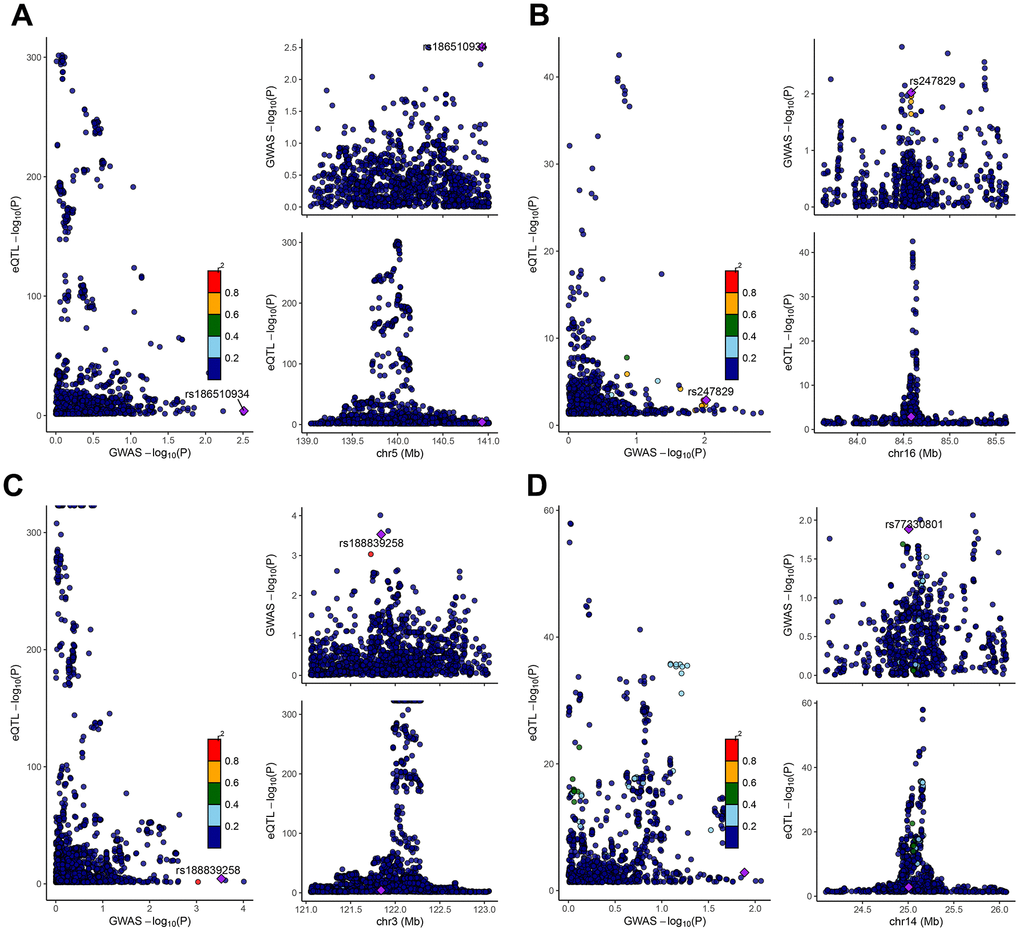
Figure 4.Co-localization analysis between SNPs of key genes and GWAS data from COPD patients. The genes represented from (A–D) were CD14, COTL1, CSTA, and GZMH, respectively. The X-axis indicated the P-value of GWAS, and the Y-axis indicated the P-value of eqtl.