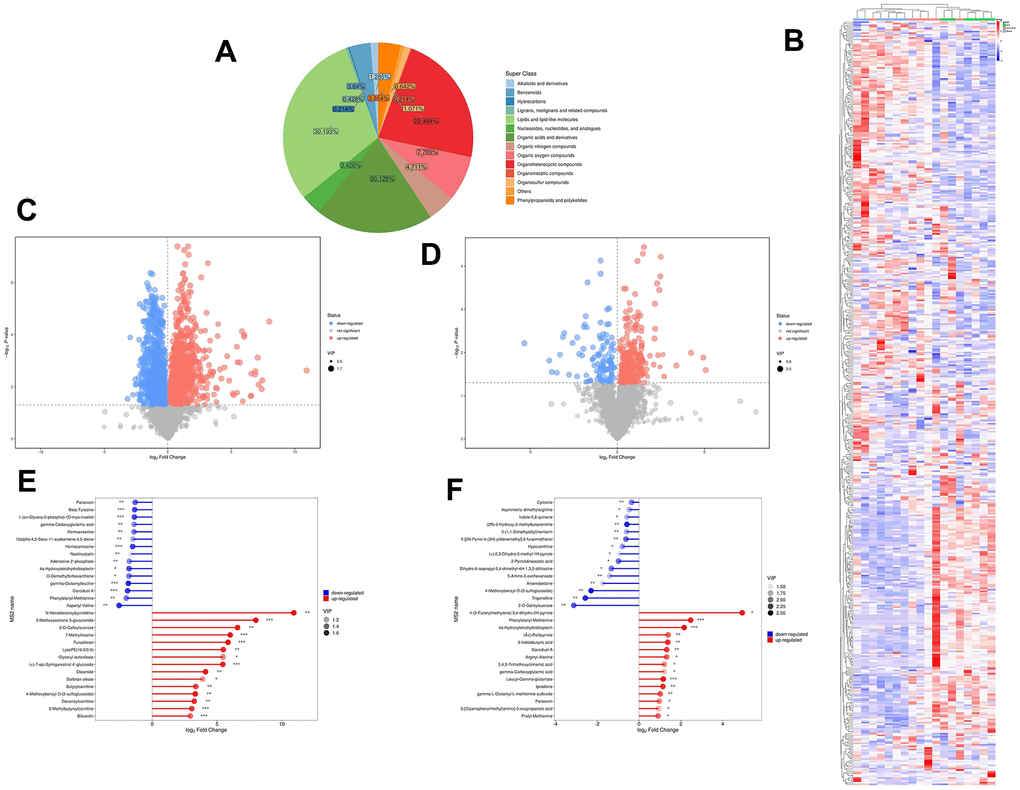
Figure 13.Metabolite comprehensive analysis. (A) Representative Pie chart showing the metabolite classification and proportion. (B) The Heatmap showing the results of the hierarchical clustering analysis for all groups. (C, D) Significantly up-regulated metabolites are represented in red, while those significantly down-regulated are represented in blue, unchanged metabolites are shown in gray. The comparisons between ICH and control groups (C) or ICH + JFG and ICH groups (D) are showed. (E, F) The first 15 most up- or down-regulated metabolites are displayed. The comparisons between ICH and control groups (E) or ICH + JFG and ICH groups (F) are showed.