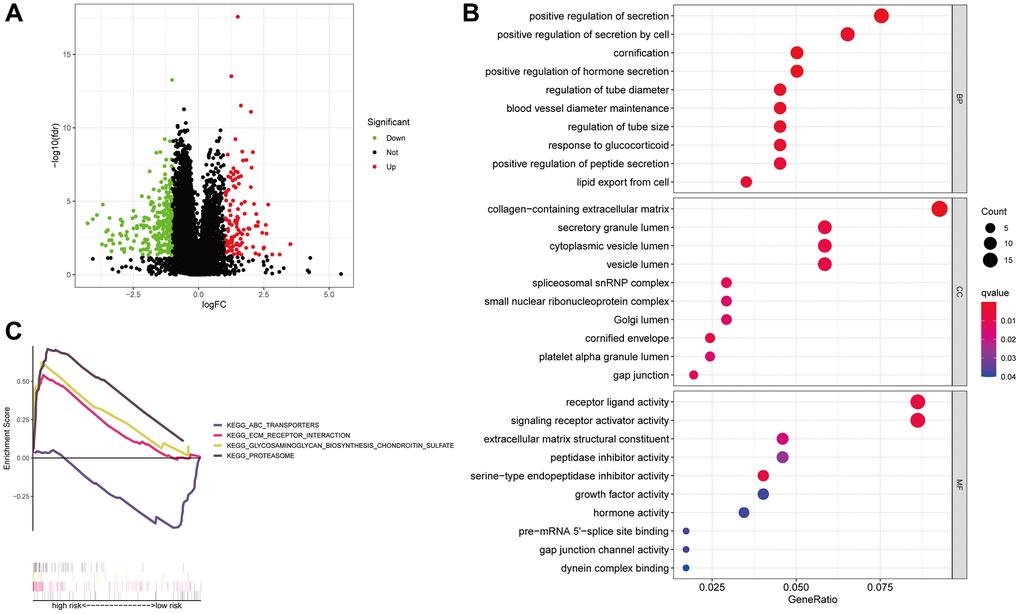
Figure 8.Anoikis-associated lncRNA signature functional enrichment. A volcano diagram illustrating the differential expression of genes (DEGs) among patients with LUAD (A). The GO analysis-derived bubble chart of DEGs between the two groups (B). GSEA-illustrated functional annotation between high- and low-risk groups (C).