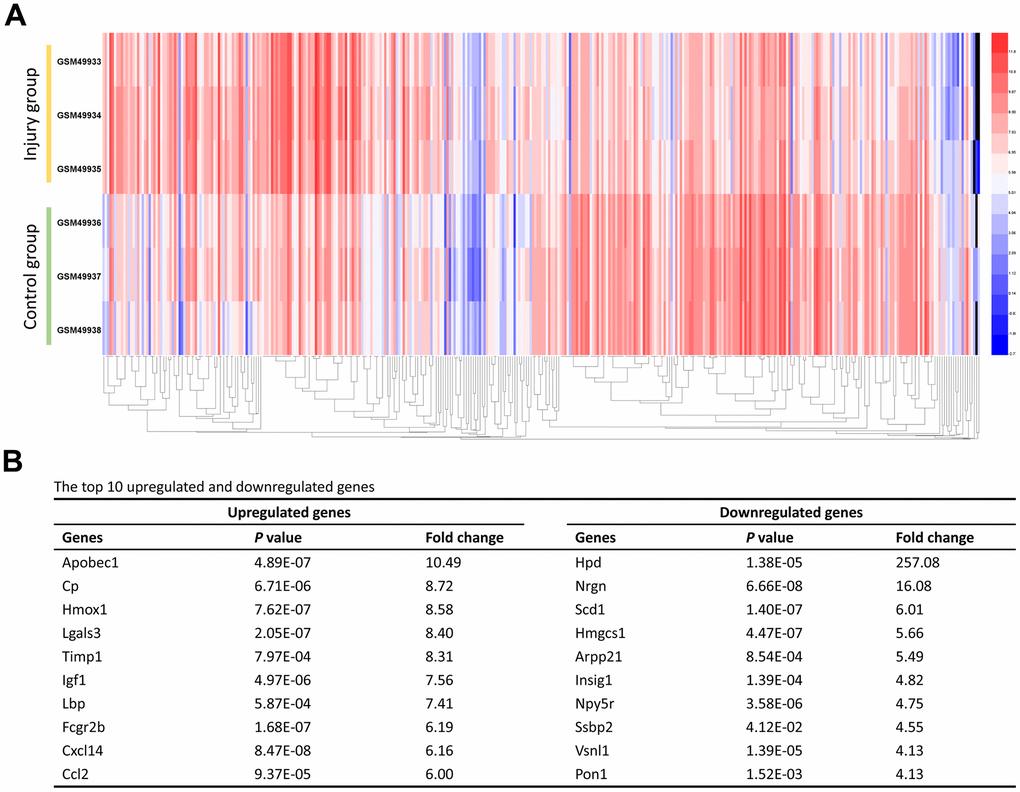
Figure 1.Identification of the DEGs. (A) The heat map of the 416 DEGs. Changes in genes expression (P < 0.05, logFC > 1.0 or logFC < -1.0) are illustrated by a heat map. Blue indicates a relatively low expression and red indicates a relatively high expression. (B) The top 10 upregulated and downregulated genes.