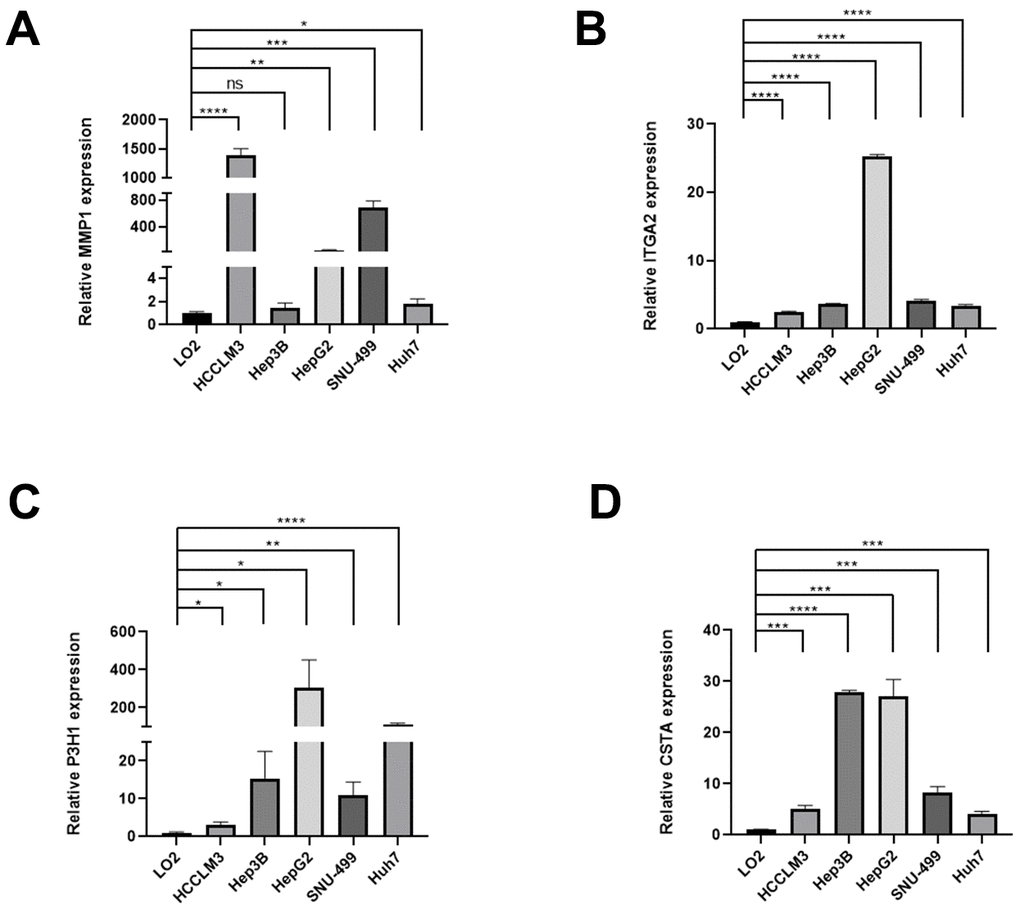
Figure 10.The expression differences of normal liver and HCC cell lines. The expression differences of MMP1 (A), ITGA2 (B), P3H1 (C), and CTSA (D) in normal liver and HCC cell lines.
Figure 10 — Comprehensive evaluation of genes related to basement membrane in hepatocellular carcinoma | Aging