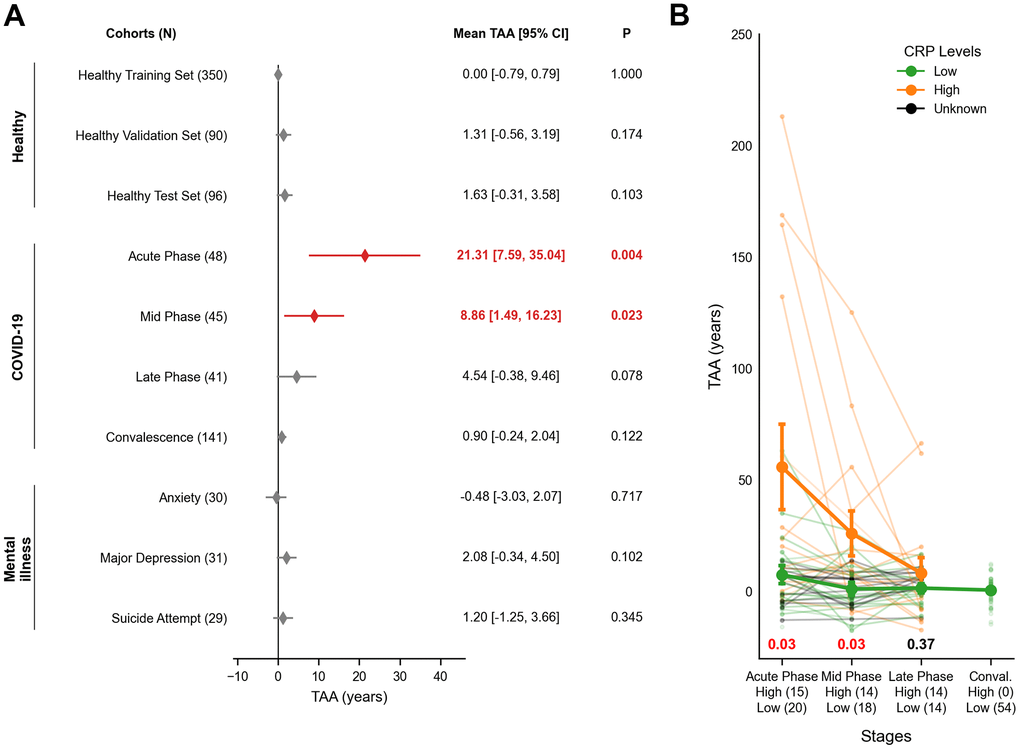
Figure 2.Transcriptomic age acceleration (TAA) across healthy, COVID-19 and mental illness cohorts. (A) A forest plot illustrates interval estimates of TAA across cohorts. Red-filled diamonds indicate statistically significant TAA (P < 0.05), while grey-filled diamonds denote no significance. The x-axis represents TAA in years, and the y-axis lists the study cohorts. Nominal P-values for TAA are displayed on the right-hand side, with bold red figures indicating statistical significance. (B) A line plot depicts TAA trajectories in COVID-19 patients, stratified by CRP levels (Low, High, and Unknown). The x-axis shows infection stages with respective sample sizes of High and Low CRP groups, while the y-axis displays TAA in years. Bold lines represent the group trends for High CRP (orange) and Low CRP (green) groups. Error bars indicate the mean ± SEM. Nominal P-values are shown at the bottom for each phase using two-sided Welch's t-test. Red indicates statistical significance while black shows no significance. The group trend of Unknown CRP (green) was omitted. SEM = Standard Error of Sample Means; TAA = Transcriptomic Age Acceleration.