


Introduction
The aging clock is a machine learning model that estimates biological age based on omics data, capturing molecular changes beyond chronological age [1]. DNA methylation has been widely used as a primary aging biomarker [2, 3]. However, its gene regulatory effects remain poorly understood, complicating biological interpretation [4, 5]. Gene expression offers a more functionally relevant biomarker with enhanced temporal resolution compared to CpG site-based measures [6–8]. This enables gene expression to reflect whole-body health conditions in real physiological time with greater acuity.
Certain genes exhibit consistent expression changes in blood throughout the human lifespan, correlating with age-related phenotypes such as IL-6 levels and muscle strength [9–11]. Building on these findings, Peters et al. (2015) pioneered a blood transcriptomic clock based on 1,497 genes associated with chronological age from large-scale microarray data. The clock showed stronger correlations with age-related blood traits, such as blood pressure and cholesterol, than with chronological age [12]. Ren and Kuan (2020) introduced a concept of transcriptomic age acceleration analogous to epigenetic age acceleration. Here, they illustrated accelerated age among cancer subtypes measured by multi-tissue RNA clocks [13]. Moreover, Holzscheck and colleagues (2021) inferred accelerated transcriptomic age in skin fibroblasts from patients with Hutchinson–Gilford Progeria Syndrome (HGPS) and reduced transcriptomic aging in mice undergoing caloric restriction (CR) [14]. Recent advancements have expanded transcriptomic clocks to single-cell resolution to scrutinize the cell-type-specific progression of biological aging [15, 16].
Despite these developments, the application of RNA clocks to systematically investigate transcriptomic age shifts caused by disease states remains limited, particularly in East Asian populations. Robust biomarkers associated with these shifts also remain underexplored.
This study fills these critical gaps by leveraging bulk mRNA sequencing to investigate the transcriptomic age shifts in blood during both transient (COVID-19) and chronic (Mental illnesses) pathological states. We also identify novel aging biomarkers to provide deeper molecular insight into the aging process.
Results
Whole blood mRNA accurately predicts chronological age in healthy individuals
We developed a machine learning model to predict transcriptomic age using bulk RNA sequencing data from 350 healthy individuals of Korean ethnicity (Supplementary Figure 1). From 13,834 stably expressed genes in whole blood, 301 genes were significantly correlated with chronological age (|r| > 0.35 and FDR < 0.05, Supplementary Table 1). Using the LARS LASSO method, we constructed a linear prediction model that selected 36 genes with strong predictive power. The model achieved high accuracy in the training cohort (R2train = 0.80; Figure 1A) and robust performance in validation and test cohorts of 90 and 96 individuals, respectively (R2validation = 0.70 and R2test = 0.63; Figure 1B, 1C). Consistent age-gene correlations were observed across all cohorts (Supplementary Figure 2).
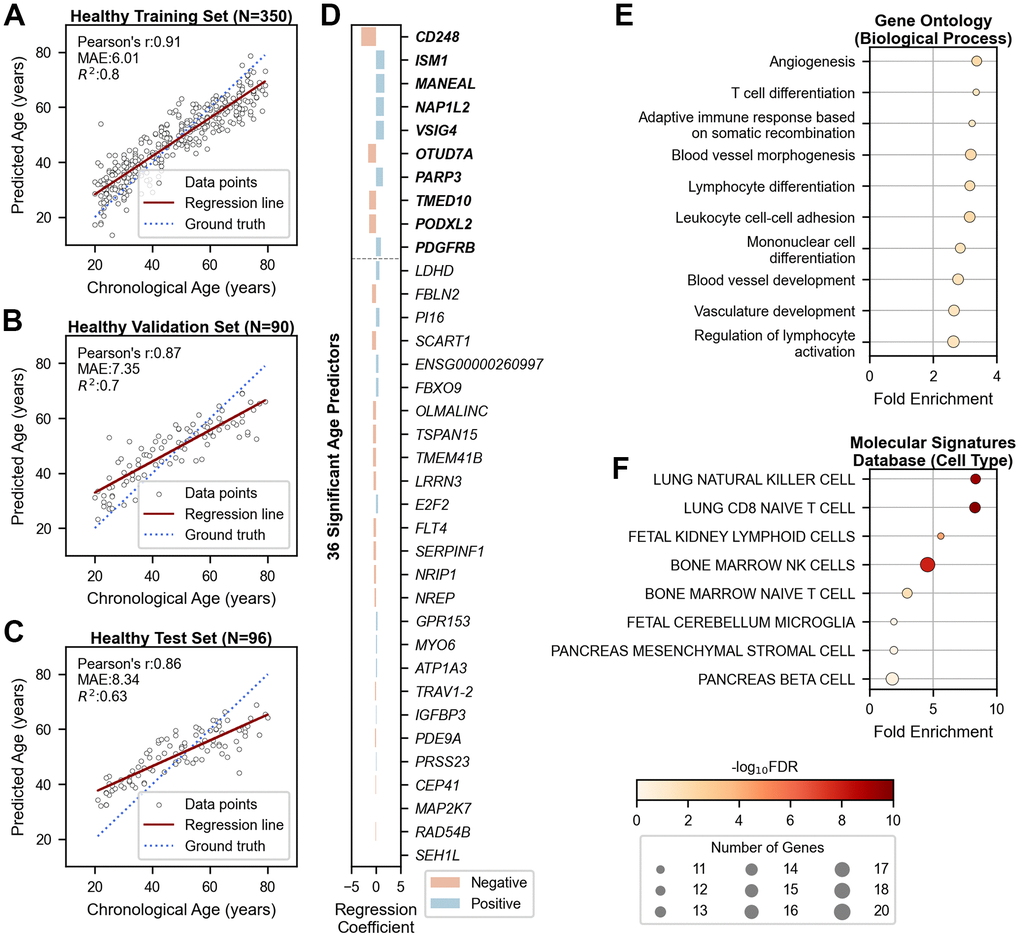
Figure 1. Chronological age prediction using 36 genes in healthy cohorts. (A–C) Scatter plots showing the performance of the age prediction model on (A) training (N=350), (B) validation (N=90), and (C) independent test (N=96) data. The x-axis shows chronological age, and the y-axis shows predicted age based on the mRNA clock. Each sample is represented by an open black dot, with a solid red line indicating the regression trend and a dotted blue line indicating perfect correlation. (D) Bar plot showing genes ranked by their importance in age prediction. The x-axis shows regression coefficients, and the y-axis lists the gene symbols of the 36 age-predictive genes. The top ten genes are shown in bold. Blue and red bars indicate positive and negative associations with aging, respectively. (E, F) Dot plots displaying gene-set enrichment results of the 36 age-predictive genes with their 180 co-expressed genes based on (E) Gene Ontology (Biological Processes) and (F) Molecular Signatures Database (Cell Type). The x-axis represents fold enrichment, and the y-axis portrays the top ten annotated biological functions, sorted by fold enrichment (FDR < 0.05). Dot color denotes the statistical significance, and dot size indicates the number of enriched genes. MAE = Mean Absolute Error; r = Pearson’s Correlation Coefficient; R2 = Coefficient of Determination; FDR = False Discovery Rate.
Our clock outperformed existing transcriptomic aging clocks for Korean samples but performed less effectively on Caucasian samples compared to Ren Clock trained on the same ethnicity (GSE134080; Supplementary Figure 3). These results emphasize the necessity of population-specific models, justifying the development of a tailored RNA clock for accurate age prediction in Korean individuals.
The 36 age-predictive genes, ranked by regression coefficients, revealed both positive and negative associations with aging (Figure 1D and Supplementary Table 2). Gene-set enrichment analysis with 180 co-expressed genes highlighted angiogenesis and lymphoid immunity as the dominant pathways (FDR < 0.05; Figure 1E, 1F). A two-dimensional t-SNE plot of the 36 genes revealed moderate stratification according to age groups, but did not differentiate between sex groups within the embedded space (Supplementary Figure 4).
Transcriptomic age acceleration in response to COVID-19 and mental illnesses
The 36-gene clock was applied to disease cohorts for analysis. Despite a near-uniform age distribution across cohorts (Supplementary Figure 5), the clock failed to accurately predict the chronological age of certain unhealthy individuals (Supplementary Figure 6). We quantified transcriptomic age acceleration (TAA) to measure the deviation between chronological and transcriptomic age. Healthy cohorts showed no significant age acceleration (Figure 2A; Healthy). Mean TAA of the healthy cohorts in validation was no more than 0.98 years (95% CI: -0.79 to 3.6, FDR = 0.199), supporting their non-diseased status (Supplementary Table 3).
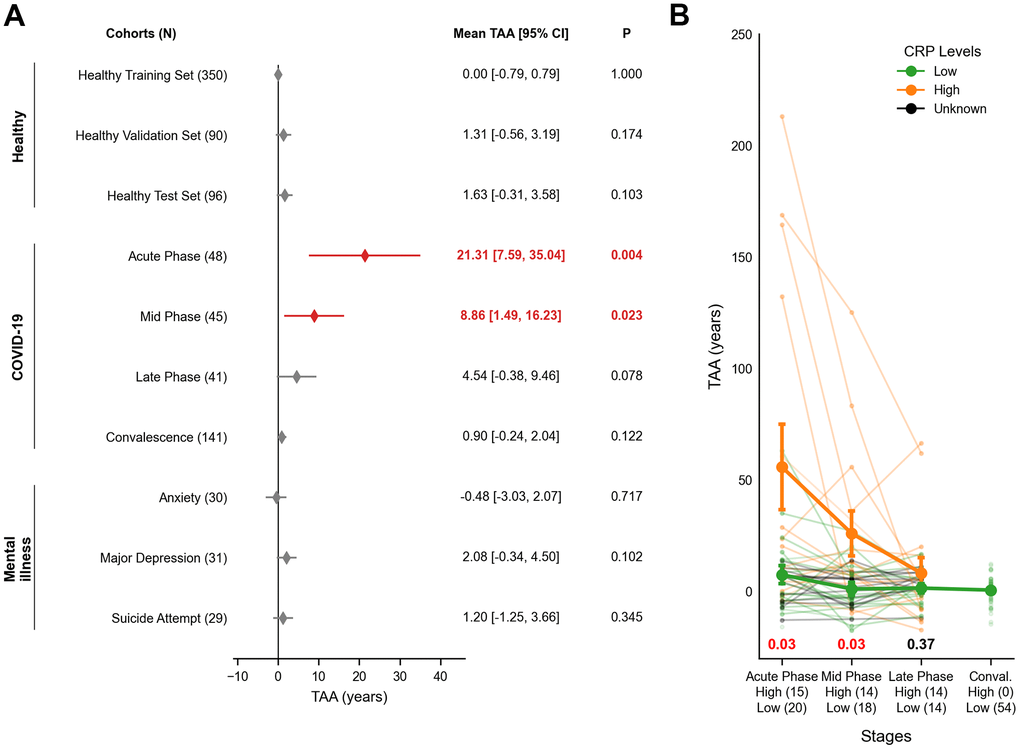
Figure 2. Transcriptomic age acceleration (TAA) across healthy, COVID-19 and mental illness cohorts. (A) A forest plot illustrates interval estimates of TAA across cohorts. Red-filled diamonds indicate statistically significant TAA (P < 0.05), while grey-filled diamonds denote no significance. The x-axis represents TAA in years, and the y-axis lists the study cohorts. Nominal P-values for TAA are displayed on the right-hand side, with bold red figures indicating statistical significance. (B) A line plot depicts TAA trajectories in COVID-19 patients, stratified by CRP levels (Low, High, and Unknown). The x-axis shows infection stages with respective sample sizes of High and Low CRP groups, while the y-axis displays TAA in years. Bold lines represent the group trends for High CRP (orange) and Low CRP (green) groups. Error bars indicate the mean ± SEM. Nominal P-values are shown at the bottom for each phase using two-sided Welch's t-test. Red indicates statistical significance while black shows no significance. The group trend of Unknown CRP (green) was omitted. SEM = Standard Error of Sample Means; TAA = Transcriptomic Age Acceleration.
In SARS-CoV-2 infection, longitudinal samples showed significant TAA during the acute phase (mean TAA = 21.31 years; 95% CI: 7.59 to 35.04, P = 0.004). This dramatically declined in mid (8.86 years; 95% CI: 1.49 to 16.23, P = 0.023) and late phases (4.54 years; 95% CI: -0.38 to 9.46, P = 0.078). Notably, an independent cohort of 141 convalescent samples showed no evidence of acceleration (0.90 years; 95% CI: -0.24 to 2.04, P = 0.122) (Figure 2A; COVID-19). Consistent with these findings, TAA was negatively correlated with the time since infection, indicating a gradual return to transcriptomic homeostasis (Regression coefficient = -8.49, P = 0.02; Supplementary Figure 7). Expression dynamics of the 36 blood aging biomarkers in COVID-19 mirrored these trends, with VSIG4 levels declining during acute phases and recovering over time, independent of stage-specific differentially expressed genes (Supplementary Figure 8 and Supplementary Table 4).
COVID-19 patients with higher inflammatory status, indicated by C-reactive Protein (CRP), showed significantly elevated TAA during acute and mid phases (P = 0.03 for both), while no differences were observed in the late phase (P = 0.37; Figure 2B). TAA was also associated with higher neutrophil counts, lower lymphocyte counts, and declining serum albumin levels (P < 0.05; Supplementary Figure 9).
In psychiatric cohorts, TAA was modest and statistically insignificant overall (mean TAA = 0.94 years; 95% CI: -3.03 to 4.50, FDR = 0.199; Supplementary Table 3). These results suggest that acute infection drives transient TAA more strongly than chronic conditions such as mental illnesses.
Validation of transcriptomic age acceleration in public infection cohorts
To validate the dynamics of transcriptomic age acceleration (TAA), we analyzed publicly available RNA-seq datasets from two independent cohorts: COVID-19-related acute respiratory distress syndrome (ARDS; GSE273149) and Hepatitis C Virus infection (HCV; GSE119117).
In the COVID-19 ARDS cohort, non-survivors exhibited persistent TAA across all measured time points. On Day 1, TAA was 46.14 years (95% CI: 31.55 to 60.74, P = 0.003), remaining elevated on Day 3 (37.75 years; 95% CI: 16.90 to 58.60, P = 0.024) and Day 7 (49.33 years; 95% CI: 12.15 to 86.52, P = 0.060). By Day 10, TAA increased further (58.36 years; 95% CI: 25.18 to 91.55, P = 0.041), reflecting unresolved systemic inflammation and failure to recover (Figure 3A). Survivors, in contrast, showed high TAA on Day 1 (75.15 years; 95% CI: 34.87 to 115.44, P = 0.035) but showed a progressive return to baseline by Day 7 (31.72 years; 95% CI: 22.94 to 40.49, P = 0.006) and Day 10 (22.59 years; 95% CI: 9.95 to 35.23, P = 0.177), indicating recovery (Figure 3A). Although not statistically significant, COVID-19 survivors exhibited an initial increase in TAA compared to non-survivors on Day 1 (+13.86 years, P = 0.26), which reversed upon Day 10 (-35.77 years, P = 0.13; Figure 3B). Accordingly, TAA trajectories in survivors trended downward to baseline, whereas non-survivors showed sustained elevation at Day 7 (Pinteraction = 0.047; Supplementary Table 5).
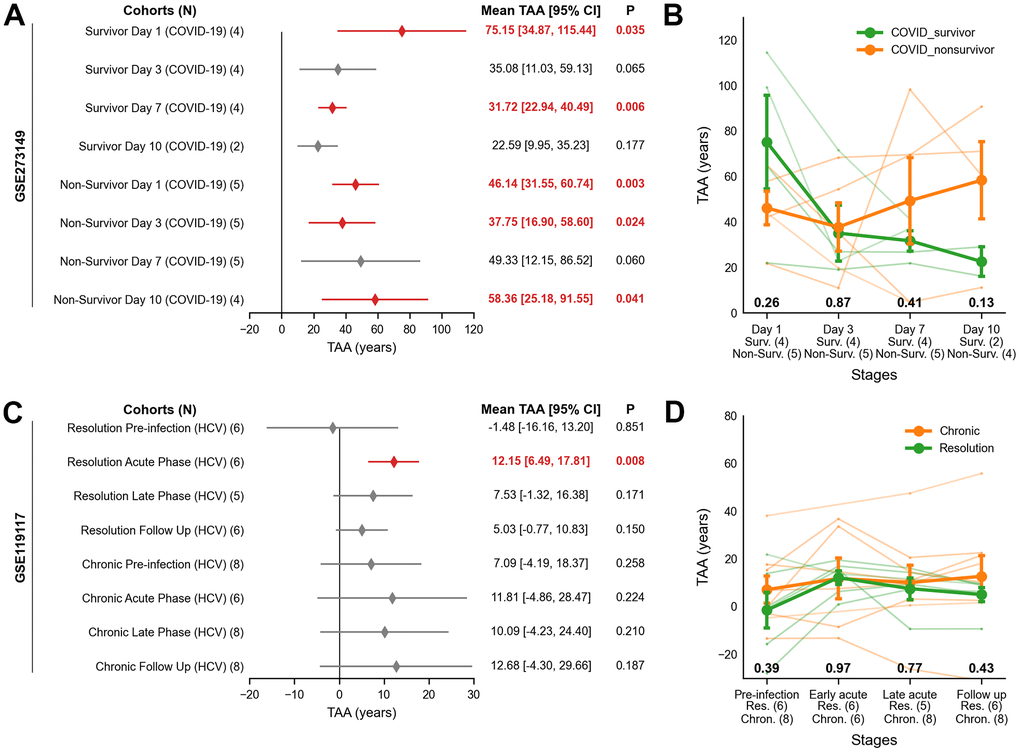
Figure 3. Transcriptomic age acceleration (TAA) across COVID-19 ARDS and HCV cohorts using publicly available RNA-seq data. (A, B) COVID-19 ARDS cohort. (A) Forest plot showing the interval estimates of TAA. Statistically significant TAA values (P < 0.05) are indicated by red-filled diamonds, while non-significant values are marked with grey-filled diamonds. The x-axis represents TAA in years, and the y-axis shows cohort labels. Statistical results for TAA are listed on the right, with significant values in bold red. (B) Line plot of TAA trajectories stratified by clinical outcome (survivors, orange; non-survivors, green). The x-axis indicates infection stages with sample sizes; the y-axis shows TAA in years. Lines represent group means ± SEM; nominal P-values from two-sided Welch’s t-test are shown below each phase. (C, D) HCV cohort. (C) Forest plot showing TAA in years with significance as in (A). (D) Line plot of TAA trajectories stratified by resolution stage (chronic, orange; resolution, green), with interpretation as in (B). ARDS = Acute Respiratory Distress Syndrome, Chron. = Chronic; HCV = Hepatitis C Virus; Non-Surv. = Non-Survivor; Res. = Resolution; SEM = Standard Error of Sample Means; Surv. = Survivor; TAA = Transcriptomic Age Acceleration.
In the HCV cohort, TAA was 12.15 years (95% CI: 6.49 to 17.81, P = 0.008) in the acute phase of the resolved cases, decreasing to 5.03 years (95% CI: -0.77 to 10.83, P = 0.150) during follow-up. Pre-infection samples showed negligible TAA (-1.48 years, 95% CI: -16.16 to 13.20, P = 0.47). Chronic HCV cases exhibited stable TAA across all stages, with no significant changes (P > 0.05, Figure 3C). Across all stages, there was no evidence of TAA difference between resolution (green) and chronic (orange) groups (P > 0.05, Figure 3D). TAA trajectories in HCV showed no significant distinction between the subgroups (Pinteraction > 0.05, Supplementary Table 5).
Discussion
Our study provides compelling evidence for the reversibility of transcriptomic age in response to systemic stressors such as infections [17, 18]. In whole blood, transcriptomic age exhibits dynamic and transient shifts that are independent of chronological age. These shifts likely reflect deviations from a healthy state rather than permanent changes in biological age, given that the clock was exclusively trained on the chronological age of non-diseased individuals. Notably, transcriptomic age closely tracked the inflammatory course of COVID-19 patients from acute illness through recovery. Among clinical markers, C-reactive Protein (CRP) exhibited the strongest correlation with transcriptomic age acceleration (TAA). CRP is a well-established inflammation marker linked to increased all-cause mortality, including sepsis-related deaths [19, 20].
Early inflammatory response is critical in determining later disease outcomes [21]. In COVID-19, a robust initial inflammatory surge facilitates viral clearance and recovery, while a delayed or insufficient response can lead to prolonged systemic inflammation and adverse clinical outcomes [22]. Despite the small sample size, the COVID-19 ARDS cohort demonstrated that survivors exhibited a sharp inflammatory surge which resolved to baseline, indicating effective immune activation. Non-survivors had a blunted response with persistently high TAA, reflecting immune failure and disease progression. Taken together, blood transcriptomic age is a useful proxy for age-associated inflammatory responses, offering insights into disease progression through the lens of aging biology.
CXCL9, a plasma protein previously implicated in inflammation and experimentally validated to promote endothelial cell senescence [23], showed a positive correlation with chronological age in our whole blood data. However, the strength of this correlation was insufficient for inclusion in our analysis (Supplementary Table 6). Instead, VSIG4 emerged as a key surrogate marker of blood aging. VSIG4, a potent negative regulator of pro-inflammatory macrophages and T-cells, demonstrated significant downregulation during recovery, indicating a reduced inflammatory environment [24, 25]. Alongside NREP, a gene included in the 36-gene set, VSIG4 has been identified as a deleterious signature of aging across multiple tissues and species [26].
Viruses act as pro-aging factors. Virus-induced senescence (VIS) is linked to disease severity through senescence-associated secretory phenotypes (SASPs), which drive systemic inflammation [27]. While causality remains to be established, our results suggest that infection-induced changes in aging biomarkers challenge the notion of aging as merely a risk factor for infection susceptibility [28]. Recent studies indicate that senolytics mitigate complications of viral infections, highlighting their therapeutic potential [29, 30]. Moreover, our findings support the role of anti-aging interventions in improving vaccine efficacy [31]. Taken together, these results underscore the potential for repurposing anti-aging interventions as complementary strategies to enhance resilience and health outcomes in the context of infectious diseases.
Mental health issues have been associated with epigenetic age acceleration [32], and chronic psychosocial stress has been implicated in epigenetic aging [33]. However, our results did not align with these findings. We suggest that the transcriptomic clock may be more sensitive to acute stress, such as COVID-19, rather than chronic stress, such as mental health disorders. Future research should involve larger sample sizes and classify patients based on clinically approved indices to better establish a definitive relationship.
Our study highlights significant challenges in predicting transcriptomic age across diverse ethnic groups. A clock trained on a single ethnic group failed to generalize across populations, with our Korean-trained clock overestimating age in Caucasian COVID-19 patients (Supplementary Figure 10) and performing poorly on the predominantly Caucasian GTEx dataset (Supplementary Figure 11). This mirrors Ren & Kuan’s observation that ethnicity-matched models minimize error [13], indicating that blood aging signatures are compounded by ethnic-specific genetic, environmental, and socioeconomic factors [34, 35]. Moreover, technical variability in RNA sequencing – such as differences in RNA quality, sample handling, and sequencing platforms – introduces batch effects that exacerbate prediction errors. In future, comprehensive batch correction methods, such as ComBat-seq and RUVSeq, should be systematically employed in both intra- and inter-ethnic contexts to ensure reproducible cross-cohort age prediction [36, 37].
Recent studies propose that aging clocks reflect stochastic molecular variation, or entropy, accumulated over time [38, 39]. While our clock is primarily driven by inflammation, inflammation itself may amplify transcriptional variability [40, 41], implying that stochasticity is a core component of the blood transcriptomic clock presented here. Although we have utilized LASSO regression to prioritize highly performant features of age prediction, we cannot confidently claim that all 36 genes, including VSIG4 and NREP, reflect programmed aging. Future studies are warranted to elucidate the variance explained by entropic aging in the clock, particularly at the single-cell level to resolve cellular heterogeneity that is masked in bulk transcriptomic data as used in our study.
Materials and Methods
Study population and sample collection
We collected a total of 559 whole blood samples from healthy donors who participated in the Korean Genome Project (KGP) with no apparent disease onset at the time of blood draw [42, 43]. Additionally, we obtained 124 whole blood samples from the Mental Health Cohort [44]. From the COVID-19 Infection and Recovery Cohorts, we collected 146 and 141 whole blood samples, respectively. Out of the 146 COVID-19 Infection Cohort samples, 134 samples were longitudinally collected from 48 subjects over a one-month period, covering the acute (N=48), mid (N=45), and late (N=41) phases of infection (unpublished).
Bulk mRNA sequencing using illumina sequencers
Whole blood samples collected in PAXgene® Blood RNA Tubes were stored frozen at -80° C. Total RNA extraction utilized the PAXgene Blood RNA Kit from Qiagen following the manufacturer’s protocol. RNA quality was assessed by analyzing 1 μl on the Bioanalyzer system (Agilent) to ensure RNA Integrity Number (RIN) and rRNA ratio met required standards. We used 100 ng of total RNA for library preparation with the TruSeq RNA Library Prep Kit and TruSeq Stranded mRNA Sample Preparation Kit (Eukaryote) for the HiSeq2500 and NovaSeq5000 platforms, respectively, following the manufacturer’s instructions. Library quality was assessed with the Agilent 2100 BioAnalyzer and quantified using the KAPA library quantification kit (Kapa Biosystems). Paired-end (2×101 or 2×151) RNA sequencing was performed on HiSeq2500 and NovaSeq5000 sequencers.
Bulk mRNA sequencing using BGI/MGI sequencers
To enrich polyadenylated mRNA and deplete rRNA, we used the Dynabeads mRNA Purification Kit (Invitrogen). Libraries were assessed for size distribution using the Agilent D1000 ScreenTape. Library preparation was conducted using BGI’s custom protocol or the MGIEasy RNA Directional RNA Library Prep Set (BGI) for the BGISeq500 and DNBSEQ-T7 platforms, respectively, following manufacturer protocols. Library quantification was performed using the Qubit 2.0 Fluorometer with the Qubit DNA HS Assay kit (Thermo Fisher Scientific). Paired-end (2×100 or 2×150) RNA sequencing was conducted on the DNBSEQ-T7RS (MGI) platform.
Quality check and expression quantification
Sequenced RNA reads had adapters removed and were filtered for low-quality reads using fastp (version 0.23.1) with default options [45]. The filtered RNA reads were aligned to the human reference genome FASTA (GRCH38 p.13) using STAR (version 2.7.10b) with default settings [46]. Only those samples with Q30 Rate > 0.90, GC Rate > 0.46, and Total Mapping Rate > 70% were included (Supplementary Tables 7, 8). Transcripts and respective genes were annotated with their Ensembl ID and gene symbol using the annotation GFF3 file (GENCODE version 43) and RSEM (version 1.3.3) [47]. We removed any genes with duplicate gene symbols. Raw expression of each gene was estimated by RSEM (version 1.3.3) with default parameters [48]. DESeq2 (version 1.42.0; R package) was used to normalize the expression counts for sequencing depth and RNA library composition [49]. To normalize raw counts from publicly available RNA-seq data, size factors were computed using the geometric means of genes across samples in the Korean study population with the “geoMean” argument in the “estimateSizeFactors” function of the DESeq2 package.
Expression count preprocessing
To ensure stable mRNA signals, genes with a median expression of zero were removed. Then, we removed the genes with median expression below 20. This reduced the number of input genes from 69,222 to 13,834. The remaining genes had their expression values standardized across the samples to Z-scores using “preprocessing.StandardScaler” (scikit-learn version 1.3.2). The mean and standard deviation for the scaler were calculated using the training dataset only.
Sample selection for training the age prediction model
We randomly selected samples from our RNA-seq dataset to achieve a near-uniform age distribution. Of the initial 440 samples, 350 were assigned to the training dataset and 90 to the validation dataset in an 80:20 ratio using “model_selection.train_test_split” (scikit-learn version 1.3.2). The split was stratified into six age group bins using “np.digitize” (numpy version 1.26.2). From the principal component analysis (PCA) using all 13,834 genes, we separated out the cluster of 90 samples with distinct batch information and expression profiles – sequencing performed in 2019 by BGISeq500 platform. PCA was performed using “decomposition.PCA” from scikit-learn (version 1.3.2) for each cohort.
Finding age-associated genes via simple correlation analysis
DESeq2-normalized expression values of each gene were correlated with chronological age using Pearson’s test, restricted to the 350 samples in the training dataset to prevent data leakage. P-values were adjusted for multiple tests using the Benjamini-Hochberg approach with “stats.multitest.fdrcorrection” (statsmodels version 0.14.0). Genes with |r| > 0.35 and FDR < 0.05 were considered significantly associated with chronological age.
Korean blood transcriptomic clock
The LARS (Least Angle Regression) LASSO (Least Absolute Shrinkage and Selection Operator) model was trained on 350 healthy samples the genes of significant age correlation using “linear_model.LassoLarsIC” (scikit-learn version 1.3.2) with default parameters. Here, we assume that the combined effect of age-predictive genes on the sample age is simply a linear combination of their expression. Given our sample size, we proceeded the feature selection with information criterion (asymptomatically equal to Leave-one-out cross-validation) to prevent over- or under-fitting [50]. For detecting the optimal regularization strength (i.e., alpha), we chose a model with the lowest value of Bayesian information criterion (BIC) by iteratively minimizing the BIC (Supplementary Table 9).
Peters and ren blood transcriptomic clock
Transcriptomic age by Peters Clock was calculated using “TranscriptomicPredictionModel” function from BioLearn [51]. Ren Clock was calculated using “RNAAgeCalc” function from racpy [13] with following options: tissue = “blood”, stype = “Caucasian”, and signature = “GTExAge”.
Model validation
Model validation was conducted by testing datasets of independent RNA-seq experiments in predicting the biological age. Pearson’s correlation (r), Mean Absolute Error (MAE), and Coefficient of Determination (R2) were calculated as measurements indicating performance using “pearsonr”, “np.mean”, and “metrics.r2_score”, respectively (scipy.stats version 1.11.4; numpy version 1.26.2; scikit-learn version 1.3.2).
Functional enrichment of age-predictive genes and their co-expressed genes
A gene co-expression matrix was constructed from gene expression data of 350 whole blood samples, calculating expression-expression correlations using “pandas.DataFrame.corr” with “pearsonr” option (pandas version 2.1.3). The top five highly co-expressed genes with 36 age-predictive genes were selected for downstream analysis. All 13,834 genes after the preprocessing based on their expression level have been used as the background gene set. ShinyGO (version 0.81) [52] was used to functionally annotate genes.
Dimension reduction using t-SNE
To visualize the distinct expression patterns across age groups and sex, we employed t-distributed Stochastic Neighbor Embedding (t-SNE), a dimensionality reduction technique that preserves local structure in high-dimensional data, in this case, gene expression data. The analysis was performed on the expression levels of 36 age-predictive genes across 350 blood samples used in training the age prediction model. The pre-processed expression counts were transformed into 2D t-SNE embeddings using the “TSNE.fit_transform” function with “n_components=2” as an option (sklearn.manifold version 1.3.2).
Transcriptomic age acceleration (TAA)
Transcriptomic Age Acceleration (TAA) is the difference between predicted (transcriptomic) and chronological age at which the blood was drawn from a sample. Prediction error confidence intervals were determined using “sem” (scipy.stats version 1.11.4) and tested for significance using two-tailed, one-sample t-tests using “ttest_1samp” (scipy.stats version 1.11.4).
Trajectories of TAA across infection stages
The trajectories of transcriptomic age acceleration (TAA) were analyzed in Korean COVID-19, Caucasian COVID-19 ARDS, and Caucasian HCV cohorts across infection stages, as measured by each study. In the Korean COVID-19 cohort, patients were stratified by C-reactive protein (CRP) levels (High and Low). High serum CRP level was defined as CRP > 1mg/dL, and low as CRP ≤ 1mg/dL. In the Caucasian COVID-19 ARDS cohort, patients were classified by mortality: survivor and non-survivor. In the Caucasian HCV cohort, patients were divided according to patient outcome: resolution and chronic disease. Two-sided Welch’s t-tests was performed to obtain nominal P-values distinguishing age acceleration at each stage of infection, using “ttest_ind” (scipy.stats version 1.11.4) with equal_var = False. In addition to the t-tests, a mixed-effects regression model (random intercepts and fixed slopes) was employed to account for individual variability and fixed effects, using “mixedlm” (statsmodels version 0.14.0). We tested the significance of interaction effects between infection stage and disease outcome on TAA. Wald’s test was used to assess the significance of the regression coefficients, with a p-value threshold of < 0.05 considered statistically significant.
Stage-specific differentially expressed genes (DEGs) in COVID-19
Raw read counts estimated from RSEM were compared between 48 COVID-19 subjects longitudinally collected and 350 healthy bloods in the training data at acute (N=48), mid (N=45), and late (N=41) phases. DESeq2 (version 1.42.0; R package) was used to discover differentially expressed genes using Wald’s test (design: Sample_Trait + Sample_Sex). Those genes with baseMean below 10 were removed. COVID-19 significant gene set (i.e., COVID19) was defined as those genes with statistics of |log2FoldChange|≥1 and FDR < 0.05 while the non-significant gene set (i.e., None) as |log2FoldChange| < 1 and FDR > 0.05. The 36 age predictor genes belong to AgePred gene set. Differences in expression levels were tested using Kruskal-Wallis test with post-hoc Dunn’s test for pairwise comparisons, correcting p-values with “bonferroni” option in “posthoc_dunn” (scikit-posthocs version 0.9.0).
Clinical correlates of transcriptomic age acceleration (TAA)
Clinical lab values of routine blood tests were correlated with Transcriptomic Age Acceleration (TAA) using “pearsonr” (scipy.stats version 1.11.4). Significance was adjusted for multiple comparisons using “stats.multitest.fdrcorrection” (statsmodels version 0.14.0).
Calculating TAA in GTEx expression data
We obtained raw GTEx (version 8) gene expression data from the GTEx Portal [53]. We extracted only those samples collected from the whole blood for downstream analysis. Then, DESeq2 normalization was performed using geometric means of genes calculated from the samples of Korean ethnicity, as described previously. TAA was calculated by subtracting the predicted transcriptomic age and the chronological age of the blood donors at the time of enrollment (“AGE”: phv00169063.v9.p2.c1).
Data availability
Both normalized and un-normalized read count matrices used in the analysis can be found in our GitHub page: https://github.com/korean-genomics-center/transcriptomic_clock. Raw sequencing data and materials used in the study are available from the corresponding author upon request. Public RNA-seq data used in this study, GSE134080 [54], GSE273149 [55], and GSE119117 [56], can be found in Gene Expression Omnibus. Raw expression data from the GTEx project are available at the Portal: https://www.gtexportal.org/home/downloads/adult-gtex/bulk_tissue_expression. Donor information from the GTEx project can be accessed through the dbGaP website (accession number: phs000424.v9.p2).
Code availability
The codes used to generate data and calculate statistics, as well as the respective readme files, are openly available in the GitHub page: https://github.com/korean-genomics-center/transcriptomic_clock.
Supplementary Materials
Author Contributions
K. An, D. Nam, and J. Bhak conceptualized the study. H. Ryu helped with data collection. K. An conducted the data analysis. Y. Kwon, H. Ryu, S. Jeon helped the data analysis and interpretation. J. H. Bhak helped with project design. D. Nam reviewed the methodology. K. An wrote the manuscript. All authors have contributed to this study and helped improve the paper.
Acknowledgments
We thank all voluntary participants for donating their blood and the city of Ulsan for supporting the project. We thank Ulsan University Hospital for collecting blood samples of patients with COVID-19, especially Eun-Seok Shin, Ok-Joo Sul, and Seung-Won Ra. We thank Ulsan Medical Center and Korea University Anam Hospital for collecting blood samples of patients with mental health problems, especially Hyung-Tae Jung. We thank all members of the Korean Genomic Center (KOGIC), especially Changhan Yoon, Youngmin Bhak, Dong-Hyun Shin, Hyoung-Jin Choi, and Yookyung Choi. We thank the Korea Institute of Science and Technology Information (KISTI) for providing the Korea Research Environment Open NETwork (KREONET). We also appreciate the Ulsan ICT Promotion Agency (UIPA) which provided us with the BioDataFarm (BDF) system which supports the storage, analysis, and management of the BioBigData. The GTEx data used for the analyses described in this manuscript were obtained from: the GTEx Portal on 03/21/2023 and dbGaP accession number phs000424.v9.p2 on 07/11/2024.
Conflicts of Interest
S. Jeon and H. Ryu are employees of Clinomics Inc. S. Jeon is the CEO of both Geromics Inc. and AgingLab Inc. The remaining authors declare no competing interests.
Ethical Statement and Consent
Our study complies with the ethical guidelines and regulations set forth by the Institutional Review Board (IRB) of the Ulsan National Institute of Science and Technology (UNISTIRB-15-19-A, UNISTIRB-16-13-C, and UNISTIRB-21-15-A), the Ulsan Medical Center (USH.20.013), the Ulsan University Hospital (UUH-2021-04-011-004), and the Korea University Anam Hospital (ED15006). The data in our study are derived from voluntary blood donations, with explicit, comprehensive consent obtained from all participants prior to sample collection. These consent forms clearly articulate the intended use of their data for research purposes and emphasize the voluntary nature of their participation.
Funding
This work was supported by the Promotion of Innovative Business for Regulation-Free Special Zones funded by the Ministry of SMEs and Startups (MSS, Korea) (grant number [P0016195, P0016193] (1425156792, 1425157301) (2.220035.01, 2.220036.01)). This study was also supported by the Korea Evaluation Institute of Industrial Technology (KEIT) with funding from the Ministry of Trade, Industry and Energy in 2023. Additional support was provided by grant number RS-2024-00450983. The funding bodies played no role in the design, the collection, analysis, or interpretation of the data.
References
- 1. Rutledge J, Oh H, Wyss-Coray T. Measuring biological age using omics data. Nat Rev Genet. 2022; 23:715–27. https://doi.org/10.1038/s41576-022-00511-7 [PubMed]
- 2. Hannum G, Guinney J, Zhao L, Zhang L, Hughes G, Sadda S, Klotzle B, Bibikova M, Fan JB, Gao Y, Deconde R, Chen M, Rajapakse I, et al. Genome-wide methylation profiles reveal quantitative views of human aging rates. Mol Cell. 2013; 49:359–67. https://doi.org/10.1016/j.molcel.2012.10.016 [PubMed]
- 3. Horvath S. DNA methylation age of human tissues and cell types. Genome Biol. 2013; 14:R115. https://doi.org/10.1186/gb-2013-14-10-r115 [PubMed]
- 4. Bell CG, Lowe R, Adams PD, Baccarelli AA, Beck S, Bell JT, Christensen BC, Gladyshev VN, Heijmans BT, Horvath S, Ideker T, Issa JJ, Kelsey KT, et al. DNA methylation aging clocks: challenges and recommendations. Genome Biol. 2019; 20:249. https://doi.org/10.1186/s13059-019-1824-y [PubMed]
- 5. Franzen J, Georgomanolis T, Selich A, Kuo CC, Stöger R, Brant L, Mulabdić MS, Fernandez-Rebollo E, Grezella C, Ostrowska A, Begemann M, Nikolić M, Rath B, et al. DNA methylation changes during long-term in vitro cell culture are caused by epigenetic drift. Commun Biol. 2021; 4:598. https://doi.org/10.1038/s42003-021-02116-y [PubMed]
- 6. Pagiatakis C, Musolino E, Gornati R, Bernardini G, Papait R. Epigenetics of aging and disease: a brief overview. Aging Clin Exp Res. 2021; 33:737–45. https://doi.org/10.1007/s40520-019-01430-0 [PubMed]
- 7. Park KD, Park J, Ko J, Kim BC, Kim HS, Ahn K, Do KT, Choi H, Kim HM, Song S, Lee S, Jho S, Kong HS, et al. Whole transcriptome analyses of six thoroughbred horses before and after exercise using RNA-Seq. BMC Genomics. 2012; 13:473. https://doi.org/10.1186/1471-2164-13-473 [PubMed]
- 8. Feinberg AP. The Key Role of Epigenetics in Human Disease Prevention and Mitigation. N Engl J Med. 2018; 378:1323–34. https://doi.org/10.1056/NEJMra1402513 [PubMed]
- 9. Harries LW, Hernandez D, Henley W, Wood AR, Holly AC, Bradley-Smith RM, Yaghootkar H, Dutta A, Murray A, Frayling TM, Guralnik JM, Bandinelli S, Singleton A, et al. Human aging is characterized by focused changes in gene expression and deregulation of alternative splicing. Aging Cell. 2011; 10:868–78. https://doi.org/10.1111/j.1474-9726.2011.00726.x [PubMed]
- 10. Kerber RA, O’Brien E, Cawthon RM. Gene expression profiles associated with aging and mortality in humans. Aging Cell. 2009; 8:239–50. https://doi.org/10.1111/j.1474-9726.2009.00467.x [PubMed]
- 11. Calabria E, Mazza EM, Dyar KA, Pogliaghi S, Bruseghini P, Morandi C, Salvagno GL, Gelati M, Guidi GC, Bicciato S, Schiaffino S, Schena F, Capelli C. Aging: a portrait from gene expression profile in blood cells. Aging (Albany NY). 2016; 8:1802–21. https://doi.org/10.18632/aging.101016 [PubMed]
- 12. Peters MJ, Joehanes R, Pilling LC, Schurmann C, Conneely KN, Powell J, Reinmaa E, Sutphin GL, Zhernakova A, Schramm K, Wilson YA, Kobes S, Tukiainen T, et al, and NABEC/UKBEC Consortium. The transcriptional landscape of age in human peripheral blood. Nat Commun. 2015; 6:8570. https://doi.org/10.1038/ncomms9570 [PubMed]
- 13. Ren X, Kuan PF. RNAAgeCalc: A multi-tissue transcriptional age calculator. PLoS One. 2020; 15:e0237006. https://doi.org/10.1371/journal.pone.0237006 [PubMed]
- 14. Holzscheck N, Falckenhayn C, Söhle J, Kristof B, Siegner R, Werner A, Schössow J, Jürgens C, Völzke H, Wenck H, Winnefeld M, Grönniger E, Kaderali L. Modeling transcriptomic age using knowledge-primed artificial neural networks. NPJ Aging Mech Dis. 2021; 7:15. https://doi.org/10.1038/s41514-021-00068-5 [PubMed]
- 15. Zhu H, Chen J, Liu K, Gao L, Wu H, Ma L, Zhou J, Liu Z, Han JJ. Human PBMC scRNA-seq-based aging clocks reveal ribosome to inflammation balance as a single-cell aging hallmark and super longevity. Sci Adv. 2023; 9:eabq7599. https://doi.org/10.1126/sciadv.abq7599 [PubMed]
- 16. Zakar-Polyák E, Csordas A, Pálovics R, Kerepesi C. Profiling the transcriptomic age of single-cells in humans. Commun Biol. 2024; 7:1397. https://doi.org/10.1038/s42003-024-07094-5 [PubMed]
- 17. Poganik JR, Zhang B, Baht GS, Tyshkovskiy A, Deik A, Kerepesi C, Yim SH, Lu AT, Haghani A, Gong T, Hedman AM, Andolf E, Pershagen G, et al. Biological age is increased by stress and restored upon recovery. Cell Metab. 2023; 35:807–20.e5. https://doi.org/10.1016/j.cmet.2023.03.015 [PubMed]
- 18. Cao X, Li W, Wang T, Ran D, Davalos V, Planas-Serra L, Pujol A, Esteller M, Wang X, Yu H. Accelerated biological aging in COVID-19 patients. Nat Commun. 2022; 13:2135. https://doi.org/10.1038/s41467-022-29801-8 [PubMed]
- 19. Li Y, Zhong X, Cheng G, Zhao C, Zhang L, Hong Y, Wan Q, He R, Wang Z. Hs-CRP and all-cause, cardiovascular, and cancer mortality risk: A meta-analysis. Atherosclerosis. 2017; 259:75–82. https://doi.org/10.1016/j.atherosclerosis.2017.02.003 [PubMed]
- 20. Jiang X, Zhang C, Pan Y, Cheng X, Zhang W. Effects of C-reactive protein trajectories of critically ill patients with sepsis on in-hospital mortality rate. Sci Rep. 2023; 13:15223. https://doi.org/10.1038/s41598-023-42352-2 [PubMed]
- 21. Muire PJ, Mangum LH, Wenke JC. Time Course of Immune Response and Immunomodulation During Normal and Delayed Healing of Musculoskeletal Wounds. Front Immunol. 2020; 11:1056. https://doi.org/10.3389/fimmu.2020.01056 [PubMed]
- 22. Channappanavar R, Perlman S. Pathogenic human coronavirus infections: causes and consequences of cytokine storm and immunopathology. Semin Immunopathol. 2017; 39:529–39. https://doi.org/10.1007/s00281-017-0629-x [PubMed]
- 23. Sayed N, Huang Y, Nguyen K, Krejciova-Rajaniemi Z, Grawe AP, Gao T, Tibshirani R, Hastie T, Alpert A, Cui L, Kuznetsova T, Rosenberg-Hasson Y, Ostan R, et al. An inflammatory aging clock (iAge) based on deep learning tracks multimorbidity, immunosenescence, frailty and cardiovascular aging. Nat Aging. 2021; 1:598–615. https://doi.org/10.1038/s43587-021-00082-y [PubMed]
- 24. Vogt L, Schmitz N, Kurrer MO, Bauer M, Hinton HI, Behnke S, Gatto D, Sebbel P, Beerli RR, Sonderegger I, Kopf M, Saudan P, Bachmann MF. VSIG4, a B7 family-related protein, is a negative regulator of T cell activation. J Clin Invest. 2006; 116:2817–26. https://doi.org/10.1172/JCI25673 [PubMed]
- 25. Li J, Diao B, Guo S, Huang X, Yang C, Feng Z, Yan W, Ning Q, Zheng L, Chen Y, Wu Y. VSIG4 inhibits proinflammatory macrophage activation by reprogramming mitochondrial pyruvate metabolism. Nat Commun. 2017; 8:1322. https://doi.org/10.1038/s41467-017-01327-4 [PubMed]
- 26. Tyshkovskiy A, Ma S, Shindyapina AV, Tikhonov S, Lee SG, Bozaykut P, Castro JP, Seluanov A, Schork NJ, Gorbunova V, Dmitriev SE, Miller RA, Gladyshev VN. Distinct longevity mechanisms across and within species and their association with aging. Cell. 2023; 186:2929–49.e20. https://doi.org/10.1016/j.cell.2023.05.002 [PubMed]
- 27. Lee S, Yu Y, Trimpert J, Benthani F, Mairhofer M, Richter-Pechanska P, Wyler E, Belenki D, Kaltenbrunner S, Pammer M, Kausche L, Firsching TC, Dietert K, et al. Virus-induced senescence is a driver and therapeutic target in COVID-19. Nature. 2021; 599:283–9. https://doi.org/10.1038/s41586-021-03995-1 [PubMed]
- 28. Bartleson JM, Radenkovic D, Covarrubias AJ, Furman D, Winer DA, Verdin E. SARS-CoV-2, COVID-19 and the Ageing Immune System. Nat Aging. 2021; 1:769–82. https://doi.org/10.1038/s43587-021-00114-7 [PubMed]
- 29. Aguado J, Amarilla AA, Taherian Fard A, Albornoz EA, Tyshkovskiy A, Schwabenland M, Chaggar HK, Modhiran N, Gómez-Inclán C, Javed I, Baradar AA, Liang B, Peng L, et al. Senolytic therapy alleviates physiological human brain aging and COVID-19 neuropathology. Nat Aging. 2023; 3:1561–75. https://doi.org/10.1038/s43587-023-00519-6 [PubMed]
- 30. Camell CD, Yousefzadeh MJ, Zhu Y, Prata LG, Huggins MA, Pierson M, Zhang L, O’Kelly RD, Pirtskhalava T, Xun P, Ejima K, Xue A, Tripathi U, et al. Senolytics reduce coronavirus-related mortality in old mice. Science. 2021; 373:eabe4832. https://doi.org/10.1126/science.abe4832 [PubMed]
- 31. Palacios-Pedrero MÁ, Jansen JM, Blume C, Stanislawski N, Jonczyk R, Molle A, Hernandez MG, Kaiser FK, Jung K, Osterhaus AD, Rimmelzwaan GF, Saletti G. Signs of immunosenescence correlate with poor outcome of mRNA COVID-19 vaccination in older adults. Nat Aging. 2022; 2:896–905. https://doi.org/10.1038/s43587-022-00292-y [PubMed]
- 32. Yusupov N, Dieckmann L, Erhart M, Sauer S, Rex-Haffner M, Kopf-Beck J, Brückl TM, Czamara D, Binder EB. Transdiagnostic evaluation of epigenetic age acceleration and burden of psychiatric disorders. Neuropsychopharmacology. 2023; 48:1409–17. https://doi.org/10.1038/s41386-023-01579-3 [PubMed]
- 33. Zannas AS, Arloth J, Carrillo-Roa T, Iurato S, Röh S, Ressler KJ, Nemeroff CB, Smith AK, Bradley B, Heim C, Menke A, Lange JF, Brückl T, et al. Lifetime stress accelerates epigenetic aging in an urban, African American cohort: relevance of glucocorticoid signaling. Genome Biol. 2015; 16:266. https://doi.org/10.1186/s13059-015-0828-5 [PubMed]
- 34. Hu Y, Xu Y, Mao L, Lei W, Xiang J, Gao L, Jiang J, Huang LA, Luo OJ, Duan J, Chen G. Gene Expression Analysis Reveals Age and Ethnicity Signatures Between Young and Old Adults in Human PBMC. Front Aging. 2022; 2:797040. https://doi.org/10.3389/fragi.2021.797040 [PubMed]
- 35. Crimmins EM, Thyagarajan B, Levine ME, Weir DR, Faul J. Associations of Age, Sex, Race/Ethnicity, and Education With 13 Epigenetic Clocks in a Nationally Representative U.S. Sample: The Health and Retirement Study. J Gerontol A Biol Sci Med Sci. 2021; 76:1117–23. https://doi.org/10.1093/gerona/glab016 [PubMed]
- 36. Zhang Y, Parmigiani G, Johnson WE. ComBat-seq: batch effect adjustment for RNA-seq count data. NAR Genom Bioinform. 2020; 2:lqaa078. https://doi.org/10.1093/nargab/lqaa078 [PubMed]
- 37. Molania R, Foroutan M, Gagnon-Bartsch JA, Gandolfo LC, Jain A, Sinha A, Olshansky G, Dobrovic A, Papenfuss AT, Speed TP. Removing unwanted variation from large-scale RNA sequencing data with PRPS. Nat Biotechnol. 2023; 41:82–95. https://doi.org/10.1038/s41587-022-01440-w [PubMed]
- 38. Meyer DH, Schumacher B. Aging clocks based on accumulating stochastic variation. Nat Aging. 2024; 4:871–85. https://doi.org/10.1038/s43587-024-00619-x [PubMed]
- 39. Tarkhov AE, Lindstrom-Vautrin T, Zhang S, Ying K, Moqri M, Zhang B, Tyshkovskiy A, Levy O, Gladyshev VN. Nature of epigenetic aging from a single-cell perspective. Nat Aging. 2024; 4:854–70. https://doi.org/10.1038/s43587-024-00616-0 [PubMed]
- 40. Li X, Li C, Zhang W, Wang Y, Qian P, Huang H. Inflammation and aging: signaling pathways and intervention therapies. Signal Transduct Target Ther. 2023; 8:239. https://doi.org/10.1038/s41392-023-01502-8 [PubMed]
- 41. Martinez-Jimenez CP, Eling N, Chen HC, Vallejos CA, Kolodziejczyk AA, Connor F, Stojic L, Rayner TF, Stubbington MJ, Teichmann SA, de la Roche M, Marioni JC, Odom DT. Aging increases cell-to-cell transcriptional variability upon immune stimulation. Science. 2017; 355:1433–6. https://doi.org/10.1126/science.aah4115 [PubMed]
- 42. Jeon S, Bhak Y, Choi Y, Jeon Y, Kim S, Jang J, Jang J, Blazyte A, Kim C, Kim Y, Shim J, Kim N, Kim YJ, et al. Korean Genome Project: 1094 Korean personal genomes with clinical information. Sci Adv. 2020; 6:eaaz7835. https://doi.org/10.1126/sciadv.aaz7835 [PubMed]
- 43. Jeon S, Choi H, Jeon Y, Choi WH, Choi H, An K, Ryu H, Bhak J, Lee H, Kwon Y, Ha S, Kim YJ, Blazyte A, et al. Korea4K: whole genome sequences of 4,157 Koreans with 107 phenotypes derived from extensive health check-ups. Gigascience. 2024; 13:giae014. https://doi.org/10.1093/gigascience/giae014 [PubMed]
- 44. Bhak Y, Jeong HO, Cho YS, Jeon S, Cho J, Gim JA, Jeon Y, Blazyte A, Park SG, Kim HM, Shin ES, Paik JW, Lee HW, et al. Depression and suicide risk prediction models using blood-derived multi-omics data. Transl Psychiatry. 2019; 9:262. https://doi.org/10.1038/s41398-019-0595-2 [PubMed]
- 45. Chen S, Zhou Y, Chen Y, Gu J. fastp: an ultra-fast all-in-one FASTQ preprocessor. Bioinformatics. 2018; 34:i884–90. https://doi.org/10.1093/bioinformatics/bty560 [PubMed]
- 46. Dobin A, Davis CA, Schlesinger F, Drenkow J, Zaleski C, Jha S, Batut P, Chaisson M, Gingeras TR. STAR: ultrafast universal RNA-seq aligner. Bioinformatics. 2013; 29:15–21. https://doi.org/10.1093/bioinformatics/bts635 [PubMed]
- 47. Frankish A, Carbonell-Sala S, Diekhans M, Jungreis I, Loveland JE, Mudge JM, Sisu C, Wright JC, Arnan C, Barnes I, Banerjee A, Bennett R, Berry A, et al. GENCODE: reference annotation for the human and mouse genomes in 2023. Nucleic Acids Res. 2023; 51:D942–9. https://doi.org/10.1093/nar/gkac1071 [PubMed]
- 48. Li B, Dewey CN. RSEM: accurate transcript quantification from RNA-Seq data with or without a reference genome. BMC Bioinformatics. 2011; 12:323. https://doi.org/10.1186/1471-2105-12-323 [PubMed]
- 49. Love MI, Huber W, Anders S. Moderated estimation of fold change and dispersion for RNA-seq data with DESeq2. Genome Biol. 2014; 15:550. https://doi.org/10.1186/s13059-014-0550-8 [PubMed]
- 50. Vehtari A, Gelman A, Gabry J. Practical Bayesian model evaluation using leave-one-out cross-validation and WAIC. Statistics and Computing. 2017; 27:1413–32. https://doi.org/10.1007/s11222-016-9709-3
- 51. Ying K, Paulson S, Eames A, Tyshkovskiy A, Li S, Perez-Guevara M, et al. A Unified Framework for Systematic Curation and Evaluation of Aging Biomarkers. bioRxiv. 2024:2023.12.02.569722. https://doi.org/10.1101/2023.12.02.569722
- 52. Ge SX, Jung D, Yao R. ShinyGO: a graphical gene-set enrichment tool for animals and plants. Bioinformatics. 2020; 36:2628–9. https://doi.org/10.1093/bioinformatics/btz931 [PubMed]
- 53. Battle A, Brown CD, Engelhardt BE, Montgomery SB, GTEx Consortium, Laboratory, Data Analysis &Coordinating Center (LDACC)—Analysis Working Group, Statistical Methods groups—Analysis Working Group, Enhancing GTEx (eGTEx) groups, NIH Common Fund, NIH/NCI, NIH/NHGRI, NIH/NIMH, NIH/NIDA, Biospecimen Collection Source Site—NDRI, Biospecimen Collection Source Site—RPCI, Biospecimen Core Resource—VARI, Brain Bank Repository—University of Miami Brain Endowment Bank, Leidos Biomedical—Project Management, ELSI Study, Genome Browser Data Integration &Visualization—EBI, Genome Browser Data Integration &Visualization—UCSC Genomics Institute, University of California Santa Cruz, Lead analysts:, Laboratory, Data Analysis &Coordinating Center (LDACC):, NIH program management:, Biospecimen collection:, Pathology:, and eQTL manuscript working group:. Genetic effects on gene expression across human tissues. Nature. 2017; 550:204–13. https://doi.org/10.1038/nature24277 [PubMed]
- 54. Aguirre-Gamboa R, de Klein N, di Tommaso J, Claringbould A, van der Wijst MG, de Vries D, Brugge H, Oelen R, Võsa U, Zorro MM, Chu X, Bakker OB, Borek Z, et al, and BIOS Consortium. Deconvolution of bulk blood eQTL effects into immune cell subpopulations. BMC Bioinformatics. 2020; 21:243. https://doi.org/10.1186/s12859-020-03576-5 [PubMed]
- 55. Eltobgy M, Johns F, Farkas D, Leuenberger L, Cohen SP, Ho K, Karow S, Swoope G, Pannu S, Horowitz JC, Mallampalli RK, Englert JA, Bednash JS. Longitudinal transcriptomic analysis reveals persistent enrichment of iron homeostasis and erythrocyte function pathways in severe COVID-19 ARDS. Front Immunol. 2024; 15:1397629. https://doi.org/10.3389/fimmu.2024.1397629 [PubMed]
- 56. Rosenberg BR, Depla M, Freije CA, Gaucher D, Mazouz S, Boisvert M, Bédard N, Bruneau J, Rice CM, Shoukry NH. Longitudinal transcriptomic characterization of the immune response to acute hepatitis C virus infection in patients with spontaneous viral clearance. PLoS Pathog. 2018; 14:e1007290. https://doi.org/10.1371/journal.ppat.1007290 [PubMed]