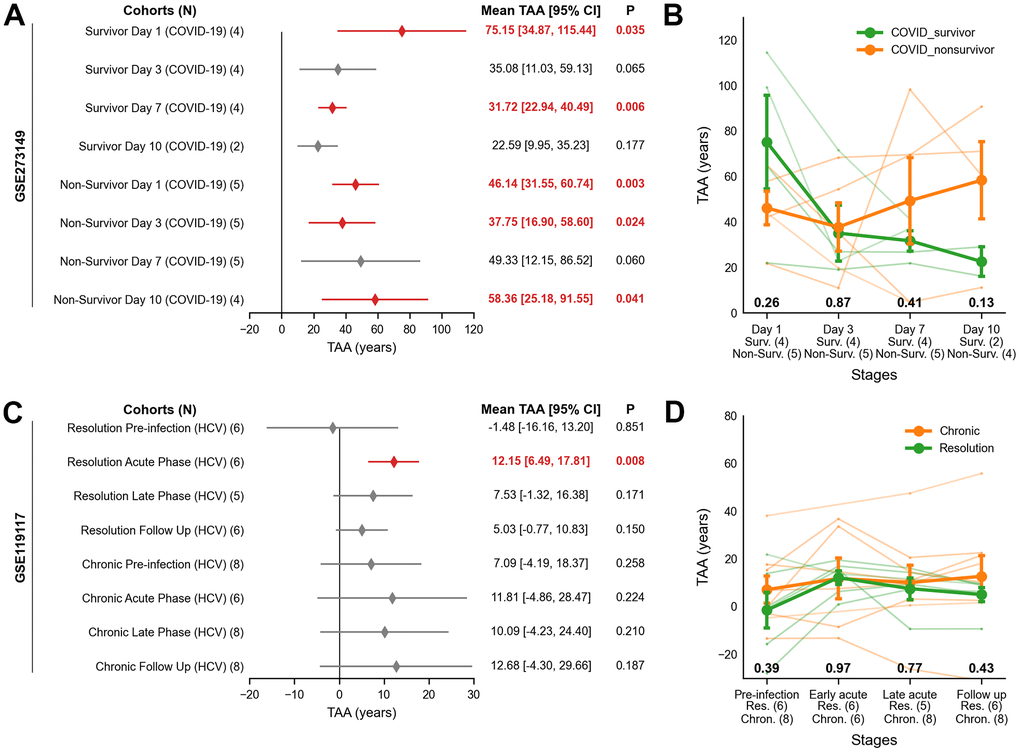
Figure 3.Transcriptomic age acceleration (TAA) across COVID-19 ARDS and HCV cohorts using publicly available RNA-seq data. (A, B) COVID-19 ARDS cohort. (A) Forest plot showing the interval estimates of TAA. Statistically significant TAA values (P < 0.05) are indicated by red-filled diamonds, while non-significant values are marked with grey-filled diamonds. The x-axis represents TAA in years, and the y-axis shows cohort labels. Statistical results for TAA are listed on the right, with significant values in bold red. (B) Line plot of TAA trajectories stratified by clinical outcome (survivors, orange; non-survivors, green). The x-axis indicates infection stages with sample sizes; the y-axis shows TAA in years. Lines represent group means ± SEM; nominal P-values from two-sided Welch’s t-test are shown below each phase. (C, D) HCV cohort. (C) Forest plot showing TAA in years with significance as in (A). (D) Line plot of TAA trajectories stratified by resolution stage (chronic, orange; resolution, green), with interpretation as in (B). ARDS = Acute Respiratory Distress Syndrome, Chron. = Chronic; HCV = Hepatitis C Virus; Non-Surv. = Non-Survivor; Res. = Resolution; SEM = Standard Error of Sample Means; Surv. = Survivor; TAA = Transcriptomic Age Acceleration.