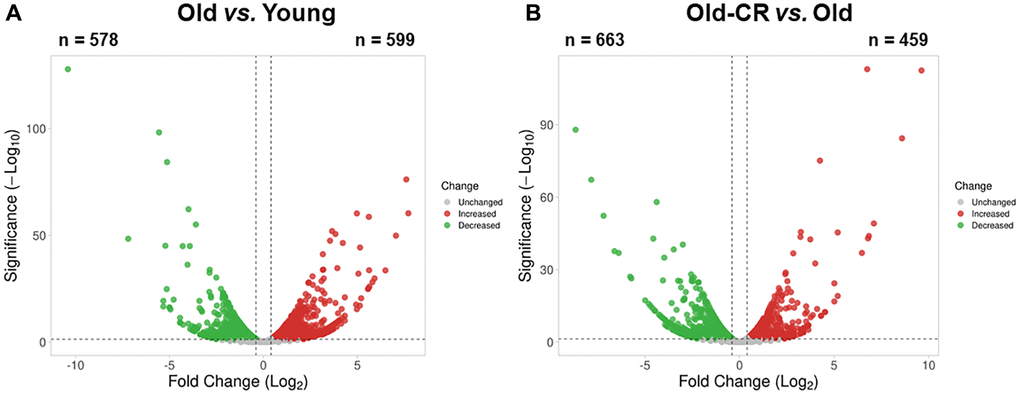
Figure 2.Aging-related differentially expressed genes from RNA-Seq data of the (A) Old vs. Young and (B) Old-CR vs. Old datasets from SD rats. Aging upregulated 599 genes and downregulated 578 genes, while CR in aged mice upregulated 459 genes and downregulated 663 genes. Red dots represent upregulated genes between the two groups, whereas green dots represent downregulated genes. Gray dots represent genes with no changes between the two groups. The DEG criteria were |FC|>1.5 and p < 0.05. Old-CR, old group under CR.